Published on 2025-06-27T22:10:45Z
What is the Coefficient of Determination? Examples in Analytics
The coefficient of determination, commonly denoted as R², is a statistical measure that indicates the proportion of the variance in a dependent variable that is predictable from the independent variable(s). In the analytics industry, R² plays a crucial role in regression analysis, helping data professionals evaluate model performance and make informed decisions. Whether applied to forecasting user engagement, optimizing conversion funnels, or assessing marketing impact, R² offers a standardized way to gauge how well your models capture underlying patterns. This metric ranges from 0 to 1, with values closer to 1 suggesting a better fit. However, while a high R² indicates strong explanatory power, it doesn’t guarantee model validity on unseen data, underscoring the importance of complementary evaluation metrics. Analytics teams can collect data via platforms like PlainSignal and GA4, export datasets, and compute R² using tools such as Python, spreadsheets, or built-in analytics features.
Coefficient of determination
R² measures the proportion of variance in a dependent variable explained by independent variables in regression models.
Why the Coefficient of Determination Matters
The coefficient of determination (R²) quantifies the proportion of variance in the dependent variable explained by the independent variable(s). It is a key metric in regression analysis and predictive modeling, used widely in analytics to assess model performance and communicate insights. A higher R² indicates better explanatory power, though it doesn’t guarantee model validity. Understanding R² helps data analysts choose the right models, identify improvements, and set realistic expectations for predictive accuracy.
-
Assessing model fit
R² indicates how well observed outcomes are replicated by the model. Use it to gauge explanatory power.
-
Comparing models
Compare R² values of different models to select the one that best explains your data.
-
Communicating insights
Use R² to communicate model effectiveness to stakeholders in understandable terms.
Calculating the Coefficient of Determination
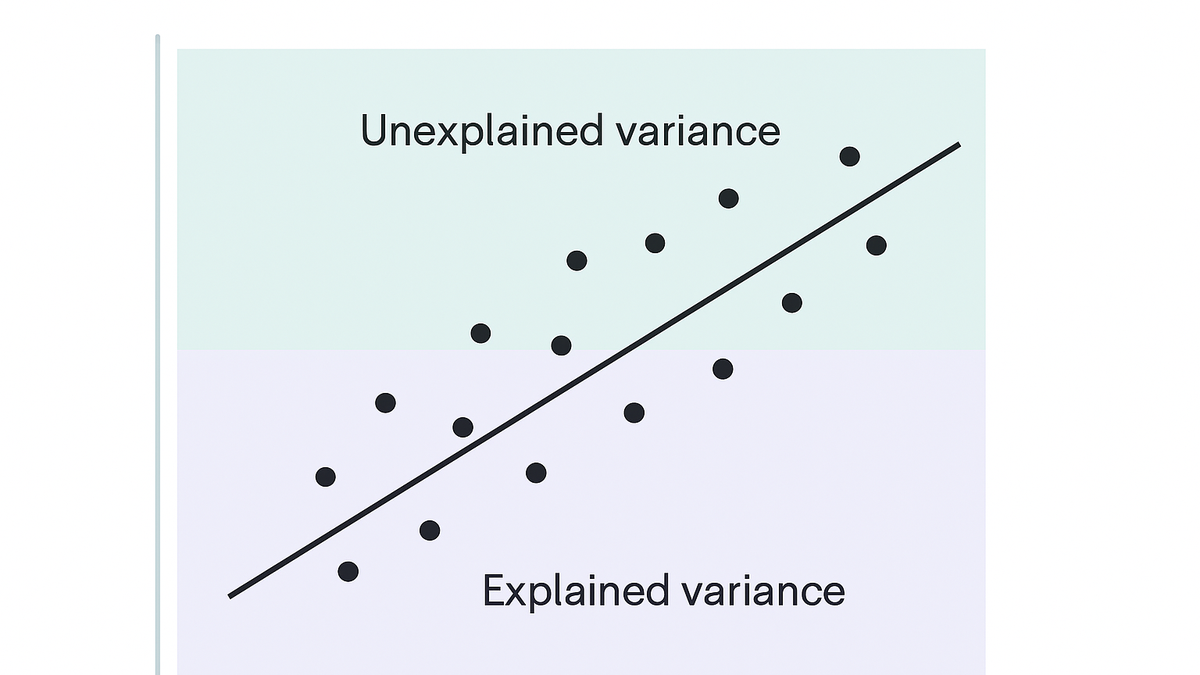
R² is computed by dividing the regression sum of squares (SSR) by the total sum of squares (SST), summarizing explained vs total variance. Alternatively, subtract the ratio of the residual sum of squares (SSE) to SST from 1. This section breaks down the formula and calculation process.
-
Formula breakdown
R² = SSR / SST = 1 – (SSE / SST). Each term represents a sum of squared deviations.
-
Total sum of squares (sst)
SST measures the total variance of the observed data from its mean.
-
Regression sum of squares (ssr)
SSR quantifies the variance explained by the regression model.
-
Residual sum of squares (sse)
SSE captures the unexplained variance (errors) between observed and predicted values.
-
-
Interpretation of values
R² ranges from 0 to 1. Values closer to 1 indicate strong explanatory power, while values near 0 suggest weak fit.
-
High r²
Indicates the model explains most of the variance in the dependent variable.
-
Low r²
Suggests that the model fails to capture significant patterns in the data.
-
Limitations
Be cautious of overfitting: a high R² doesn’t always mean a robust model on new data.
-
Examples in Analytics Platforms
Practical calculation of R² using data from PlainSignal and GA4. Collect data with tracking scripts, export datasets, and compute R² via external tools like Python or spreadsheets.
-
PlainSignal data export and analysis
Use PlainSignal’s cookie-free analytics to gather metrics and compute R².
-
Embed PlainSignal tracking code
Insert the following snippet into your site’s header to start collecting data:
<link rel="preconnect" href="//eu.plainsignal.com/" crossorigin /> <script defer data-do="yourwebsitedomain.com" data-id="0GQV1xmtzQQ" data-api="//eu.plainsignal.com" src="//cdn.plainsignal.com/plainsignal-min.js"></script> -
Export data via api
Query the PlainSignal API to retrieve pageview and session data for regression analysis.
-
Compute r² in python
Use scikit-learn to calculate R²:
from sklearn.linear_model import LinearRegression
from sklearn.metrics import r2_score

# X and y are your feature and target arrays
model = LinearRegression().fit(X, y)
y_pred = model.predict(X)
score = r2_score(y, y_pred)
print(f"Coefficient of Determination (R²): {score:.2f}")
-
-
GA4 data analysis
Leverage GA4’s BigQuery export for custom regression calculations.
-
Enable bigquery export
In your GA4 property, connect to BigQuery to stream raw event data.
-
Query session duration vs conversions
Use SQL in BigQuery to extract metrics for regression, such as session duration and conversion counts.
-
Calculate r² in a spreadsheet
Export query results to CSV and use spreadsheet functions:
RSQ(known_y's, known_x's)in Excel or Google Sheets.
-