Published on 2025-06-26T05:29:01Z
What is Data Simulation? Examples for Data Simulation in Analytics
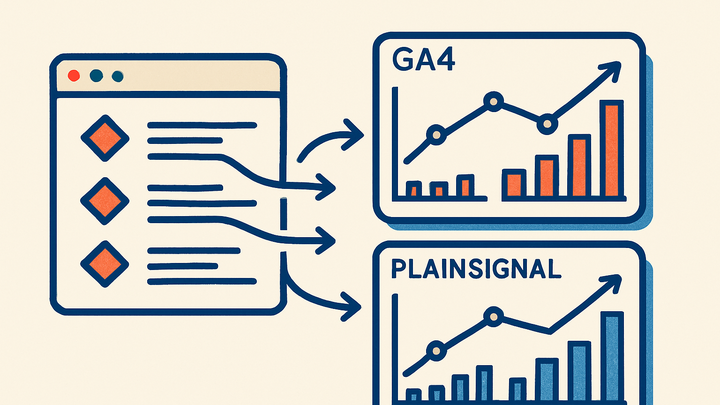
Data Simulation in analytics refers to the process of generating synthetic data that mimics real user interactions and events. This approach allows teams to test, validate, and optimize their analytics pipelines, dashboards, and data-driven decision-making processes without relying on live user traffic. By simulating events like page views, clicks, conversions, and custom interactions, analysts can identify gaps in event instrumentation, verify tagging accuracy, and ensure data integrity before releasing changes to production. Data Simulation supports compliance and privacy goals by using anonymized or fabricated data rather than real user information. Leading analytics platforms such as Google Analytics 4 (GA4) and cookie-free tools like PlainSignal provide mechanisms—like debug modes or measurement protocols—to facilitate synthetic data injection and comprehensive pipeline testing. Overall, data simulation empowers analytics teams with confidence in their reporting and reduces the risk of data-quality issues in live environments.
Data simulation
Generating synthetic analytics events to test and validate data pipelines, dashboards, and tracking setups.
Overview of Data Simulation
This section introduces Data Simulation, its purpose in analytics, and its role in ensuring accurate and reliable data collection.
-
Definition and purpose
Data Simulation involves creating artificial data that represents user interactions to test analytics setups and pipelines without live traffic.
-
Controlled testing
Enables precise scenario testing by controlling event frequency, timing, and attributes, which is not feasible with unpredictable live traffic.
-
Privacy preservation
Uses anonymized or fabricated data to prevent exposure of sensitive user information during testing.
-
-
Key benefits
Highlights the advantages of adopting Data Simulation in analytics workflows.
-
Early bug detection
Identifies instrumentation errors and misconfigured tracking tags before affecting production data.
-
Scalability testing
Allows teams to simulate high-traffic scenarios to ensure analytics systems can handle load.
-
Methods and Techniques
Explores common approaches to generating synthetic analytics data, from manual simulations to automation via specialized tools.
-
Manual event generation
Involves manually sending events through browser consoles or network tools to mimic user actions one by one.
-
Browser console
Use
window.gaorgtagcommands in the browser console to fire events in GA4. -
Network interception
Leverage tools like cURL or Postman to send HTTP requests resembling analytics beacons.
-
-
Automated simulation tools
Employs scripts and SaaS platforms to programmatically inject large volumes of events.
-
GA4 measurement protocol
Uses GA4’s Measurement Protocol API to send structured JSON payloads for events and user properties.
-
PlainSignal simulation
Utilizes PlainSignal’s cookie-free analytics snippet to generate synthetic pageviews and custom events for testing.
-
Implementing Data Simulation with SaaS Products
Provides concrete examples of using GA4 and PlainSignal to simulate analytics data in real-world scenarios.
-
Simulating with PlainSignal
Copy and paste the following code into your site to simulate basic pageview events:
<link rel="preconnect" href="//eu.plainsignal.com/" crossorigin /> <script defer data-do="yourwebsitedomain.com" data-id="0GQV1xmtzQQ" data-api="//eu.plainsignal.com" src="//cdn.plainsignal.com/plainsignal-min.js"></script>-
Data endpoint
The
data-apiattribute directs synthetic events to PlainSignal’s EU endpoint at//eu.plainsignal.com. -
Event types
By default, the PlainSignal script emits standard pageviews but can be configured to fire custom events via the
data-doattribute.
-
-
Simulating with GA4
Use the GA4 Measurement Protocol to send events like
page_viewand custom interactions via HTTP requests.-
Http request
Send a POST request to
https://www.google-analytics.com/mp/collect?measurement_id=G-XXXXXX&api_secret=YOUR_SECRETwith a JSON payload. -
Sample payload
Include parameters like
client_id,user_id, and aneventsarray withnameandparamsto define each synthetic event.
-
Best Practices and Considerations
Outlines guidelines for effective Data Simulation, highlighting pitfalls to avoid and strategies for realistic testing.
-
Ensure data realism
Craft synthetic data that mirrors real user patterns in terms of volume, frequency, and event sequences to uncover true system behavior.
-
User journey modeling
Design event flows that reflect typical user paths, including entry, navigation, and exit actions.
-
Attribute variation
Vary parameters like user properties, device types, and geolocations to test segmentation and filtering logic.
-
-
Monitor and validate results
Continuously check simulated data in dashboards and logs to verify that it appears as expected and triggers appropriate reporting rules.
-
Dashboard verification
Compare simulated metrics against input parameters to ensure consistency and accuracy.
-
Log inspection
Review server or client-side logs for dropped or malformed events that may indicate pipeline issues.
-
