Published on 2025-06-27T20:27:24Z
What is K-Means? Examples for Analytics with PlainSignal and GA4
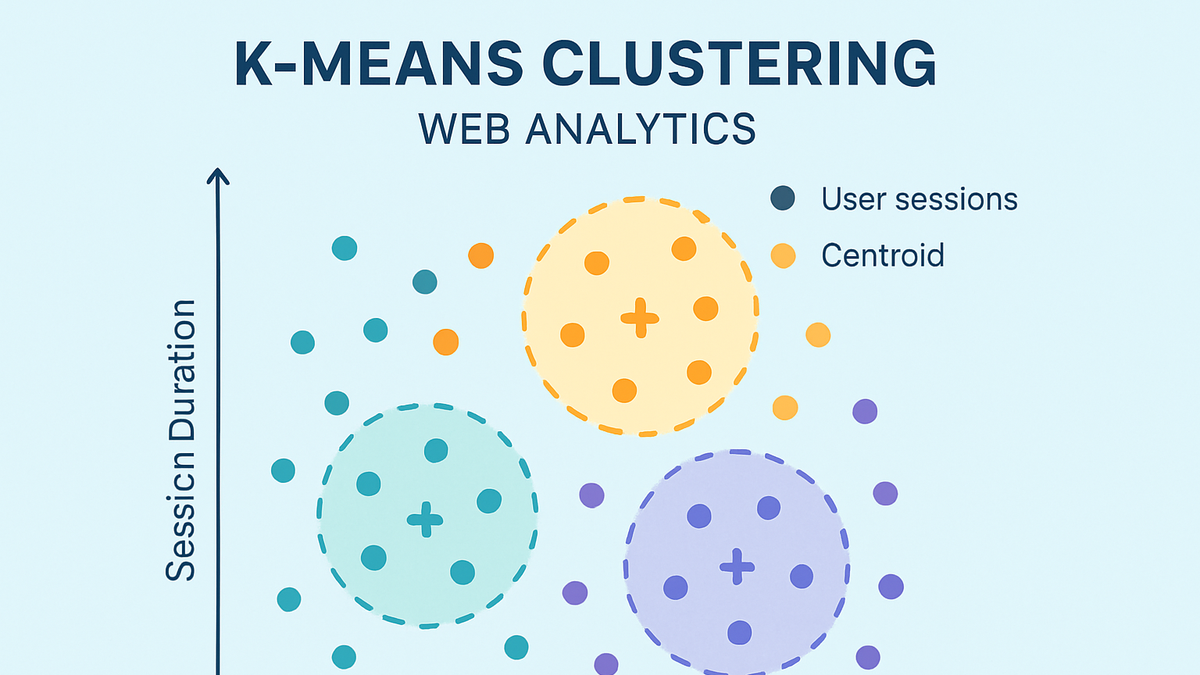
K-Means is an unsupervised clustering algorithm widely used in analytics to segment data into k distinct groups based on similarity. It works by initializing k centroids and iteratively refining their positions: assigning each data point to the nearest centroid and then recalculating centroids as the mean of the points in each cluster. This cycle repeats until centroids stabilize or a maximum number of iterations is reached, minimizing within-cluster variance.
In web analytics, K-Means helps uncover user segments with similar behaviors—such as session duration, pageviews, or custom event frequencies—and group content by engagement metrics. By leveraging data from cookie-free platforms like PlainSignal or from Google Analytics 4 (GA4), analysts can implement K-Means using libraries like scikit-learn or integrate clustering into BI tools. Preprocessing steps—such as feature scaling, outlier treatment, and dimensionality reduction—are critical for accurate results. Finally, visualizing clusters in dashboards or charts helps interpret segments and validate cluster quality for data-driven decision-making.
K-means
K-Means is an unsupervised clustering algorithm in analytics that groups data into k segments based on similarity.
Why K-Means Matters in Analytics
K-Means transforms raw metrics into actionable insights by grouping similar data points. It helps businesses understand diverse user behaviors, tailor experiences, and optimize resource allocation across marketing and product development.
-
User segmentation
Divide users into homogeneous groups based on behaviors like session duration, pageviews, and event counts to personalize marketing campaigns and UX flows.
-
Behavioral clustering
Identify patterns in user interactions—such as navigation habits or conversion triggers—to refine site structure and highlight high-impact content.
-
Content grouping
Cluster pages or articles by engagement metrics to recommend similar content, streamline navigation, and boost on-site retention.
How K-Means Works
The K-Means algorithm follows a simple loop of initialization, assignment, and update steps that continue until cluster centroids converge, balancing simplicity with efficiency.
-
Initialization
Select k initial centroids either at random or using the k-means++ method to improve convergence speed and final cluster quality.
-
Random initialization
Choose k data points randomly from the dataset as starting centroids.
-
K-means++
Select initial centroids probabilistically based on distance from existing centroids to spread them out.
-
-
Assignment step
Assign each data point to the nearest centroid by computing a distance metric (typically Euclidean distance).
-
Update step
Recalculate each centroid as the mean of all data points assigned to its cluster.
-
Convergence
Repeat assignment and update steps until centroids move below a movement threshold or a maximum number of iterations is reached.
Implementing K-Means with PlainSignal and GA4
Integrate data collection, preprocessing, clustering, and visualization in a streamlined pipeline using PlainSignal’s cookie-free tracking or GA4’s API and run the algorithm with Python or BI tools.
-
Data collection
Gather raw metrics by embedding PlainSignal’s lightweight script or exporting event-level data from GA4. This forms the basis for clustering analysis.
-
PlainSignal tracking code
<link rel="preconnect" href="//eu.plainsignal.com/" crossorigin /> <script defer data-do="yourwebsitedomain.com" data-id="0GQV1xmtzQQ" data-api="//eu.plainsignal.com" src="//cdn.plainsignal.com/plainsignal-min.js"></script> -
GA4 data export
Use GA4’s Reporting API or BigQuery Export to fetch event-level data. For example:
SELECT
  event_date,
  event_name,
  user_pseudo_id,
  (SELECT value.string_value FROM UNNEST(event_params) WHERE key = "page_path") AS page_path,
  (SELECT value.int_value FROM UNNEST(event_params) WHERE key = "engagement_time_msec") AS engagement_time_msec
FROM `your-project.analytics_XXXXXX.events_*`
LIMIT 1000;
-
-
Preprocessing and feature engineering
Normalize or standardize numeric metrics (e.g., session duration, pageviews), handle missing values, and construct feature matrices suitable for clustering.
-
Running k-means in python
Leverage scikit-learn’s KMeans class to fit the model on your preprocessed data. For example:
from sklearn.cluster import KMeans # X is your feature matrix kmeans = KMeans(n_clusters=3, init='k-means++', random_state=42) kmeans.fit(X) labels = kmeans.labels_ -
Visualizing clusters
Plot clusters with matplotlib or use BI dashboards (e.g., Data Studio, Tableau) to explore and interpret segment characteristics interactively.