Published on 2025-06-28T00:19:01Z
What is Linear Regression? Examples for Linear Regression in Analytics
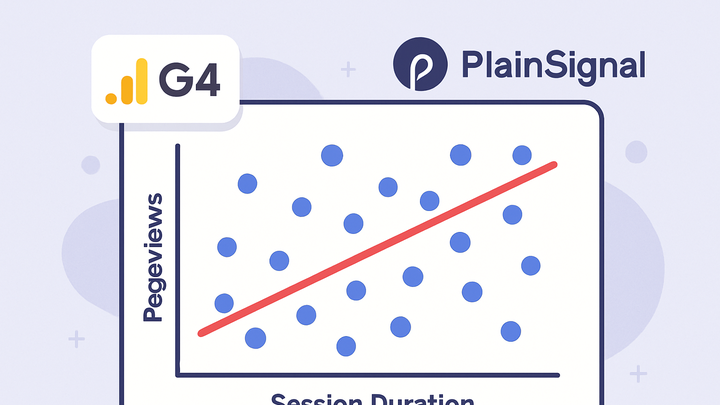
Linear regression is a fundamental statistical method in analytics for modeling and quantifying the relationship between a dependent metric and one or more independent variables. It fits a straight line—often called the line of best fit—through data points to minimize the sum of squared differences between observed and predicted values (residuals). In web analytics, practitioners use linear regression to forecast conversions based on ad spend, predict pageviews from session duration, or identify the impact of marketing campaigns on traffic volume. The model parameters (slope and intercept) are easy to interpret: the slope indicates the change in the outcome for a one-unit change in the input, and the intercept gives the baseline level when all predictors are zero. Performance metrics like R-squared and residual analysis help validate model reliability and guide optimization of analytics strategies. Data for linear regression can be sourced from platforms like Google Analytics 4 (GA4) or cookie-free solutions such as PlainSignal, enabling straightforward implementation and actionable insights.
Linear regression
Statistical method that fits a straight line to analytics data, modeling and predicting relationships between metrics.
Understanding Linear Regression
Linear regression fits a line through data points to approximate the relationship between an independent (predictor) variable and a dependent (outcome) variable. In analytics, this could mean predicting session duration based on pageviews or ad spend based on conversion rate.
-
Simple vs. multiple regression
Simple regression involves one predictor; multiple regression includes two or more predictors for more complex relationships.
-
Key components
The regression line is defined by an intercept (β₀) and slope(s) (β₁, β₂…). Residuals measure the difference between observed and predicted values.
-
Intercept (β₀)
The value of the dependent variable when all predictors equal zero.
-
Slope (coefficients β₁…βₙ)
The change in the dependent variable for a one-unit increase in the predictor.
-
Why Linear Regression Matters in Analytics
Linear regression helps analysts identify trends, quantify the impact of variables, and forecast future performance. Its interpretability and simplicity make it a staple for deriving actionable insights and informing business decisions.
-
Trend identification
Detect whether metrics like traffic or engagement rise or fall in direct relation to other variables.
-
Forecasting
Project future values (e.g., sales, pageviews) by extrapolating the regression line from historical data.
Implementing Linear Regression in Your Analytics Workflow
To apply linear regression, follow these steps: gather data via analytics platforms, preprocess it, train a model, evaluate its performance, and interpret the results. Both GA4 and PlainSignal can serve as data sources.
-
1. collect data
Gather relevant metrics using your analytics tool of choice.
-
Google analytics 4 (GA4)
Use the gtag.js snippet to send data to GA4. For example:
<!-- GA4 Example Tracking Code --> <script async src="https://www.googletagmanager.com/gtag/js?id=G-XXXXXXXXXX"></script> <script> window.dataLayer = window.dataLayer || []; function gtag(){dataLayer.push(arguments);} gtag('js', new Date()); gtag('config', 'G-XXXXXXXXXX'); </script> -
PlainSignal
Integrate PlainSignal for cookie-free analytics with a minimal script. For example:
<link rel="preconnect" href="//eu.plainsignal.com/" crossorigin />
<script defer data-do="yourwebsitedomain.com" data-id="0GQV1xmtzQQ" data-api="//eu.plainsignal.com" src="//cdn.plainsignal.com/plainsignal-min.js"></script>
-
-
2. prepare data
Clean and format the dataset: handle missing values, normalize features, and select relevant variables.
-
3. train the model
Use statistical libraries (e.g., Python’s scikit-learn) to fit a linear regression. For example:
from sklearn.linear_model import LinearRegression # Assume X and y are preprocessed arrays model = LinearRegression() model.fit(X, y) print('Coefficients:', model.coef_) print('Intercept:', model.intercept_) -
4. evaluate and interpret
Assess model performance with R-squared, p-values, and residual plots to ensure reliability and significance.
Practical Example: Predicting Conversion Rate
Predict conversion rate based on average session duration using analytics data. After exporting metrics from GA4 or PlainSignal into a CSV, you can fit a linear regression model and visualize the relationship.
-
Data extraction
Export session duration and conversion rate metrics from GA4 or PlainSignal into a file for analysis.
-
Modeling and visualization
Load the data into Python, apply linear regression, and plot results. For example:
import matplotlib.pyplot as plt

# X: session duration, y: conversion rate
plt.scatter(X, y)
plt.plot(X, model.predict(X), color='red')
plt.xlabel('Avg Session Duration')
plt.ylabel('Conversion Rate')
plt.show()
