Published on 2025-06-28T08:13:29Z
What is Multicollinearity in Analytics? Examples & Impact
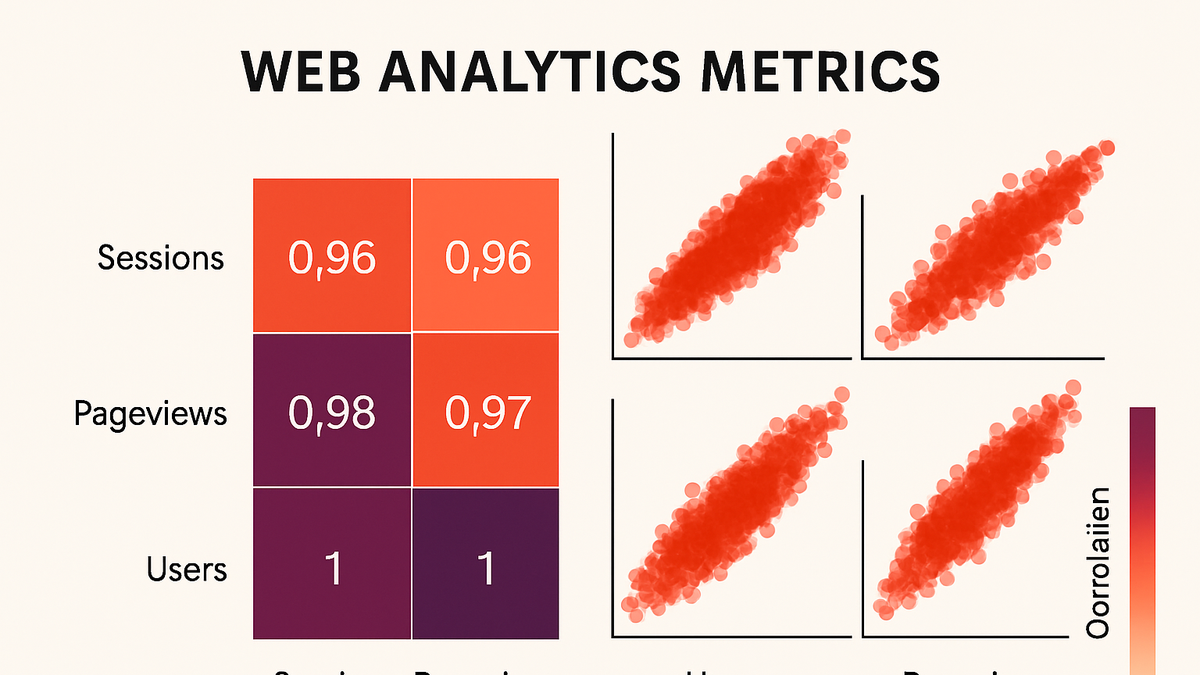
Multicollinearity occurs when two or more predictor variables in a regression model are highly correlated, making it difficult to isolate the individual effect of each variable. In web analytics, this often arises when metrics such as sessions, pageviews, and users move in tandem, leading to unreliable parameter estimates and inflated confidence intervals. When multicollinearity is present, small changes in data can produce large swings in model coefficients, reducing robustness and interpretability. Analytical tools like GA4 or PlainSignal can surface correlated metrics quickly, but it’s up to analysts to detect and mitigate this issue before building predictive models. Common indicators include high Variance Inflation Factor (VIF) values, strong pairwise correlations, and inflated standard errors. Addressing multicollinearity can involve removing or combining variables, employing dimensionality reduction techniques like PCA, or applying regularization methods such as ridge regression. Understanding and managing multicollinearity is crucial for deriving actionable insights and ensuring the accuracy of data-driven decisions.
Multicollinearity
When two or more analytics metrics used as predictors are highly correlated, causing unstable model coefficients and inflated variances.
What is Multicollinearity?
Multicollinearity is a statistical phenomenon where two or more predictor variables in a model are highly correlated, making it challenging to isolate their individual effects. In the context of web analytics, this can occur when metrics such as “users” and “sessions” or “pageviews” and “bounces” move together in similar patterns. High multicollinearity inflates the variance of coefficient estimates and can lead to unstable model parameters.
-
Statistical definition
Two or more independent variables exhibit multicollinearity when they explain similar variance in the dependent variable, violating the assumption of independent predictors in regression models.
-
Common analytics example
Metrics like sessions and pageviews often scale together—an increase in sessions usually means more pageviews—causing high pairwise correlation.
-
Sessions vs. pageviews
Both metrics track user interactions, leading to correlation coefficients often exceeding 0.9 in web traffic data.
-
Users vs. new users
The count of total users and new users are intrinsically linked, as new users form a subset of total users.
-
Why Multicollinearity Matters in Web Analytics
Multicollinearity can undermine the reliability and interpretability of predictive models in analytics. Understanding its impact helps analysts choose the right metrics and modeling techniques to derive accurate insights.
-
Unstable coefficients
Small changes in data can cause large swings in estimated coefficients, making models unreliable for forecasting or decision-making.
-
Inflated standard errors
High multicollinearity increases the standard errors of coefficients, reducing statistical significance and confidence in the estimates.
-
Misleading interpretations
When predictors overlap, it becomes difficult to attribute changes in the response variable to specific metrics.
Detecting Multicollinearity
Before building regression models, analysts should check for multicollinearity using diagnostic measures and visual tools.
-
Correlation matrix
Compute pairwise Pearson correlation coefficients among predictor variables to identify strong correlations.
-
Threshold
Correlation coefficients above 0.8 or 0.9 typically indicate problematic multicollinearity.
-
-
Variance inflation factor (vif)
Quantifies how much the variance of an estimated regression coefficient is increased due to multicollinearity.
-
Vif threshold
VIF values above 5 (or 10 in some fields) suggest high multicollinearity requiring attention.
-
-
Condition number
Based on the eigenvalues of the predictor correlation matrix; indicates overall matrix stability.
-
Condition index
Values above 30 point to strong multicollinearity issues.
-
Addressing Multicollinearity
Once detected, multicollinearity can be mitigated through variable selection, transformation, or advanced modeling techniques.
-
Remove or combine variables
Drop redundant predictors or merge them into composite metrics to reduce overlap.
-
Feature importance
Evaluate which correlated variable has more business relevance and drop the other.
-
Composite metrics
Combine correlated metrics (e.g., sum pageviews and events) into a single variable.
-
-
Dimensionality reduction
Use techniques like Principal Component Analysis (PCA) to transform correlated variables into independent components.
-
Pca
Extract orthogonal components that capture the majority of variance without multicollinearity.
-
-
Regularization methods
Apply ridge or lasso regression to penalize large coefficients and stabilize estimates.
-
Ridge regression
Introduces L2 penalty to shrink coefficients and reduce multicollinearity impact.
-
Lasso regression
Uses L1 penalty to both shrink and perform variable selection by driving some coefficients to zero.
-
Examples with GA4 and PlainSignal
Real-world examples show how multicollinearity surfaces in popular analytics platforms and how to manage it.
-
GA4 example
When exporting GA4 data to BigQuery for regression modeling, you might include both ‘sessions’ and ‘engagement_time_msec’ as predictors. These metrics often correlate strongly, inflating coefficient variances. To prevent multicollinearity, compute a correlation matrix in SQL and drop or combine variables before modeling.
-
PlainSignal example
With PlainSignal’s simple, cookie-free analytics, adding multiple tracked events can introduce correlated predictors. For instance, tracking page_view and custom ‘load’ event counts often yields similar trends:
<link rel="preconnect" href="//eu.plainsignal.com/" crossorigin />
<script defer data-do="yourwebsitedomain.com" data-id="0GQV1xmtzQQ" data-api="//eu.plainsignal.com" src="//cdn.plainsignal.com/plainsignal-min.js"></script>
Analysts should check metric correlations in the PlainSignal dashboard and exclude or transform correlated events when performing regression analyses.