Published on 2025-06-28T08:02:35Z
What is Performance Monitoring in Analytics? Examples with PlainSignal and GA4
Performance Monitoring in analytics refers to the continuous process of measuring, tracking, and analyzing the speed and responsiveness of websites or applications. By capturing metrics such as load times, server response times, and user interaction delays, teams can identify bottlenecks, prioritize optimizations, and ensure a smooth user experience. Effective performance monitoring not only enhances user satisfaction and engagement but also supports SEO efforts by meeting search engines’ Core Web Vitals thresholds. Modern SaaS tools like PlainSignal offer cookie-free, privacy-focused monitoring, while platforms like Google Analytics 4 provide integrated Web Vitals reports and customizable performance events. Combining these solutions helps businesses maintain optimal performance, improve conversion rates, and stay ahead of technical challenges.
Performance monitoring
Performance Monitoring tracks website speed and responsiveness metrics to optimize user experience, SEO, and conversion.
Why Performance Monitoring Matters
Monitoring performance is crucial because it directly impacts user satisfaction, retention, and search engine rankings. Slow or unresponsive sites can frustrate visitors, increase bounce rates, and lead to revenue loss. By proactively tracking performance, teams can detect issues early, prioritize fixes, and continuously improve the digital experience.
-
User experience impact
Slow load times frustrate users, increasing bounce rates and reducing engagement.
-
Bounce rate
The percentage of visitors who leave after viewing a single page can spike when performance is poor.
-
Session duration
Longer load times often lead to shorter sessions and fewer page interactions.
-
-
Search engine optimization
Search engines favor fast-loading websites, so performance monitoring helps maintain or improve rankings.
-
Core web vitals impact
Metrics like LCP and CLS are direct ranking factors in Google’s algorithm.
-
Mobile performance
With mobile-first indexing, ensuring quick load times on smartphones is essential for SEO.
-
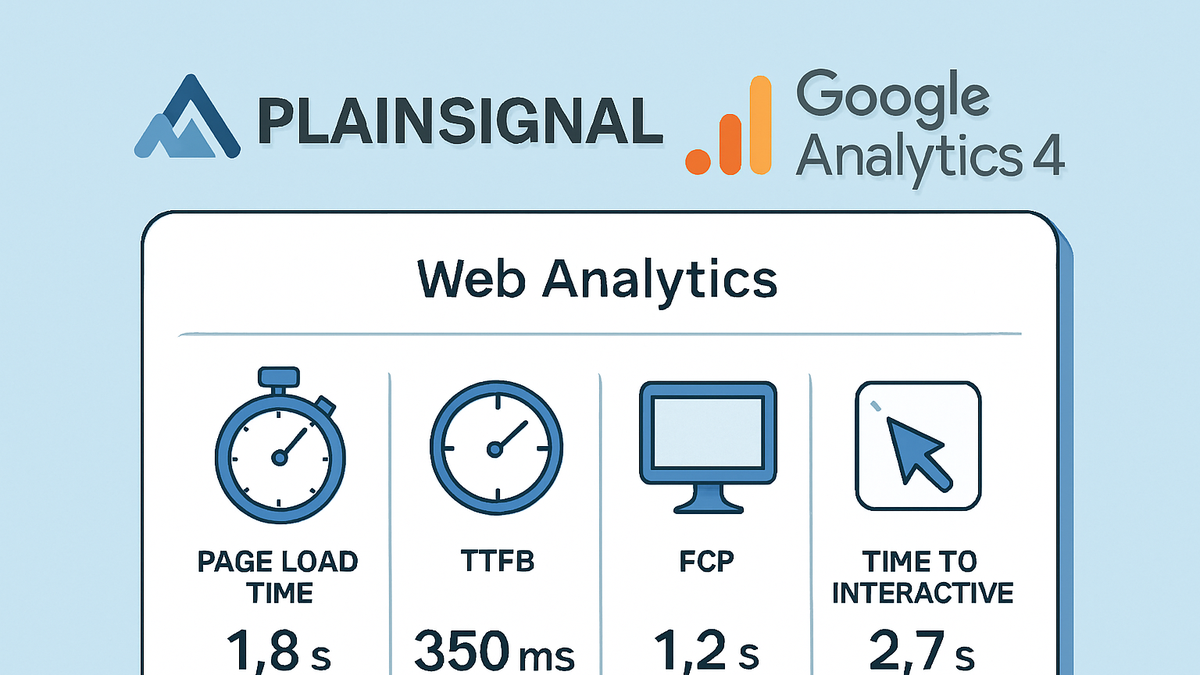
Key Metrics in Performance Monitoring
Performance monitoring relies on standardized metrics to evaluate website speed and responsiveness. Understanding these metrics is the foundation for diagnosing bottlenecks and measuring improvements over time.
-
First contentful paint (fcp)
Measures the time until the first text or image is painted, signaling when users see initial content.
-
Ideal threshold
Under 1 second is recommended for a positive initial impression.
-
-
Largest contentful paint (lcp)
Tracks when the largest visible element renders, reflecting perceived load speed.
-
Optimizing lcp
Improve LCP by optimizing images, leveraging caching, and minimizing render-blocking resources.
-
-
Time to first byte (ttfb)
Time taken for the browser to receive the first byte of data from the server, indicating backend performance.
-
Server optimization
Use CDNs, caching layers, and efficient backend logic to reduce TTFB.
-
-
Time to interactive (tti)
Time until the page is fully interactive, indicating when users can engage without delays.
-
Reducing tti
Defer non-critical JavaScript and split code to speed up interactivity.
-
Implementing Performance Monitoring with SaaS Products
Leading analytics platforms offer built-in performance tracking features. Below are setup examples for PlainSignal and Google Analytics 4 to capture key performance metrics.
-
PlainSignal setup
PlainSignal provides a cookie-free, privacy-focused approach to analytics and performance monitoring. Add the following to your site header to start capturing metrics:
<link rel="preconnect" href="//eu.plainsignal.com/" crossorigin /> <script defer data-do="yourwebsitedomain.com" data-id="0GQV1xmtzQQ" data-api="//eu.plainsignal.com" src="//cdn.plainsignal.com/plainsignal-min.js"></script>-
Preconnect optimization
The <link rel=“preconnect”> tag establishes early connections to reduce latency.
-
Configuration attributes
Use data-do to specify your domain and data-id for your unique PlainSignal project ID.
-
-
Google analytics 4 (GA4) setup
GA4 includes a Web Vitals report under Engagement. Install the gtag.js snippet and configure tracking:
<script async src="https://www.googletagmanager.com/gtag/js?id=G-XXXXXXXXXX"></script> <script> window.dataLayer = window.dataLayer || []; function gtag(){dataLayer.push(arguments)}; gtag('js', new Date()); gtag('config', 'G-XXXXXXXXXX', { 'transport_type': 'beacon' }); </script>-
Web vitals report
View Core Web Vitals metrics under Engagement > Web Vitals in the GA4 interface.
-
Custom metrics
Send additional performance data via custom events if you require deeper insight.
-
Best Practices for Effective Performance Monitoring
Follow these guidelines to collect accurate performance data without degrading the user experience.
-
Load scripts asynchronously
Use async or defer attributes on monitoring scripts to prevent blocking page rendering.
-
Async vs defer
asyncexecutes the script as soon as it’s loaded;deferwaits until after HTML parsing.
-
-
Monitor real user conditions
Capture data from actual users across devices, browsers, and network conditions.
-
Geographic sampling
Ensure you collect enough data from various regions to detect localized issues.
-
-
Set performance budgets
Define acceptable limits for key metrics and configure alerts when thresholds are breached.
-
Automated alerts
Integrate with notification services to get real-time alerts on performance regressions.
-
Common Challenges and Solutions
Performance monitoring can face issues like privacy regulations, data accuracy, and variability across users. Address these with the following strategies.
-
Data privacy and compliance
Respect user privacy by choosing cookie-free analytics and managing consent appropriately.
-
Gdpr compliance
Use solutions like PlainSignal that operate without cookies to minimize consent requirements.
-
-
Measurement accuracy
Ensure your monitoring scripts are robust and handle errors to avoid data gaps.
-
Error handling
Implement fallback logic or retry mechanisms to capture metrics even if the initial script fails.
-
-
Performance variability
Different devices and networks can produce divergent results; segment data to isolate true performance issues.
-
Segmentation strategies
Analyze metrics by device type, browser, or connection speed for targeted diagnostics.
-