Published on 2025-06-26T05:27:23Z
What is Reporting in Analytics? Examples for Reporting.
Reporting in analytics is the structured process of collecting, organizing, and presenting data to help stakeholders understand performance and make informed decisions. It transforms raw metrics into visualizations, dashboards, and narrative summaries that highlight trends, anomalies, and key insights. In an analytics context, reporting can range from real-time dashboards showing live user activity to scheduled PDF or email reports summarizing historical performance. Modern tools like Google Analytics 4 (GA4) and PlainSignal streamline report generation, allowing customization of metrics, dimensions, and visual layouts. Effective reporting ensures data accuracy, relevance, and clarity, enabling teams to track progress against objectives and react swiftly to changing conditions.
Reporting
Reporting organizes and visualizes analytics data to inform decision-making and track performance.
Definition and Scope
Reporting refers to the structured presentation of analytics data, ensuring that insights are clear, actionable, and tailored to stakeholder needs.
-
What is reporting?
At its core, reporting involves transforming raw data into understandable insights through charts, tables, and narrative summaries.
-
Scope in analytics
In analytics, reporting encompasses real-time dashboards, scheduled summaries, ad hoc queries, and automated alerts across web, mobile, and campaign data.
Key Components of Reporting
Effective reporting hinges on selecting the right metrics, ensuring data accuracy, and presenting information in ways that align with business objectives.
-
Metrics and kpis
Reports center around metrics (quantitative measurements) and KPIs (key performance indicators) that reflect strategic goals.
-
Metrics
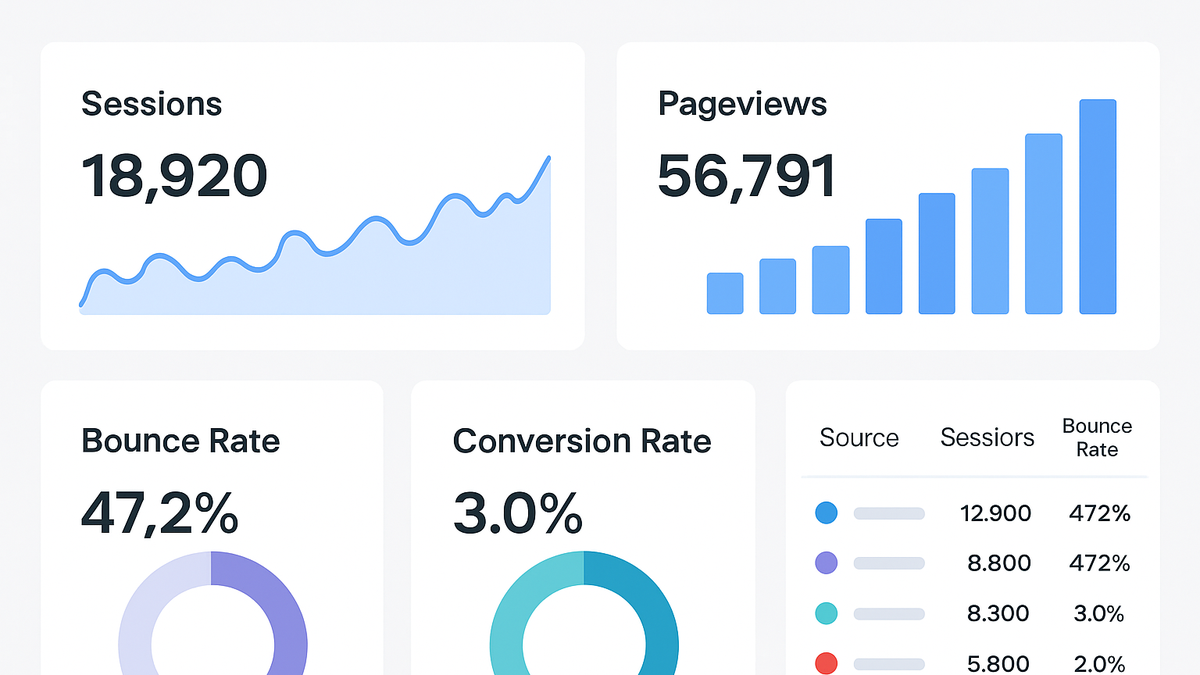
Examples include sessions, pageviews, bounce rate, and user engagement time—these raw measurements reveal user behavior.
-
Kpis
Specific metrics chosen to gauge success, such as conversion rate, average order value, or customer lifetime value.
-
-
Data sources
Common sources include web analytics platforms (GA4), privacy-focused tools (PlainSignal), server logs, and third-party APIs.
Examples with SaaS Tools
Different analytics platforms offer unique reporting capabilities. Below are examples using GA4 and PlainSignal.
-
GA4 reporting
Google Analytics 4 provides built-in reports organized into Acquisition, Engagement, Monetization, and Retention. Users can customize dimensions, apply filters, and build Exploration reports for deeper analysis.
-
PlainSignal reporting
PlainSignal is a lightweight, cookie-free analytics tool focused on privacy and simplicity. To implement PlainSignal, add this snippet to your site:
<link rel="preconnect" href="//eu.plainsignal.com/" crossorigin />
<script defer data-do="yourwebsitedomain.com" data-id="0GQV1xmtzQQ" data-api="//eu.plainsignal.com" src="//cdn.plainsignal.com/plainsignal-min.js"></script>
Once installed, PlainSignal generates straightforward reports on pageviews, referrers, and visitor locations via its dashboard.
Best Practices for Reporting
Adopt strategies that ensure reports are timely, relevant, and easy to interpret for diverse audiences.
-
Automated scheduling
Configure reports to run automatically and deliver via email or integrations (e.g., Slack) to keep teams informed without manual effort.
-
Customization and segmentation
Tailor reports by applying segments, filters, and custom dimensions to highlight insights that matter to specific stakeholders.