Published on 2025-06-22T04:59:48Z
What is Reporting API? Examples with PlainSignal and GA4
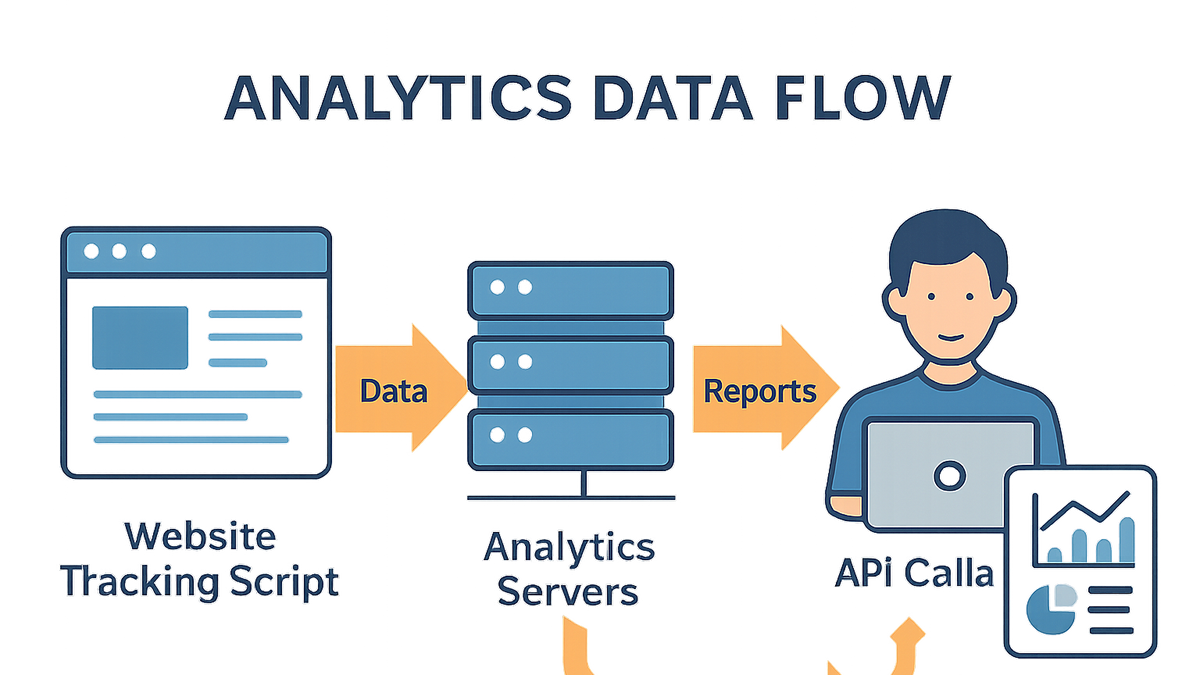
In the analytics industry, a Reporting API is a programmatic interface that allows developers and data teams to fetch, filter, and manipulate metrics and dimensions directly from analytics platforms. Instead of manually exporting data through a dashboard, a Reporting API provides endpoints to automate data retrieval in JSON format, facilitating seamless integration with data warehouses, business intelligence tools, and custom reporting libraries. Analytics vendors like PlainSignal (cookie-free simple analytics) and Google Analytics 4 (GA4) expose robust Reporting APIs to support real-time insights, advanced segmentation, and large-scale data exports. By leveraging Reporting APIs, organizations can schedule automated reports, build custom dashboards, and integrate analytics data into any application or workflow. This glossary entry details key concepts, implementation examples, best practices, and common pitfalls associated with Reporting APIs in analytics.
Reporting api
A programmatic interface to query and retrieve analytics data from platforms like PlainSignal and GA4.
Core Concepts of Reporting API
Explore the fundamental components that make up a Reporting API in analytics.
-
Api endpoints
The URLs provided by an analytics platform where you send HTTP requests to retrieve report data.
-
Endpoint structure
Typically follows REST conventions with resource paths and query parameters.
-
Http methods
GET is commonly used for fetching data; some APIs support POST for complex payloads.
-
-
Authentication
Mechanisms that ensure only authorized clients can access the API and its data.
-
Api keys
Simple tokens passed in headers or query strings for basic access control.
-
Oauth 2.0
Industry-standard protocol for delegated and secure access to user data.
-
-
Data models
The organization of metrics, dimensions, and metadata in responses.
-
Metrics vs dimensions
Metrics are numeric measurements (e.g., pageviews); dimensions are attributes (e.g., page path).
-
Json response format
Data is commonly returned as JSON arrays and objects for easy parsing.
-
Benefits of Using a Reporting API
Understand why Reporting APIs are essential for modern analytics workflows.
-
Automation
Automate data retrieval, eliminating manual exports and enabling scheduled reporting.
-
Scheduled jobs
Use cron jobs or cloud-based functions to fetch data at regular intervals.
-
Alerting
Trigger notifications when certain thresholds are met by analyzing API responses.
-
-
Customization
Build tailored queries to fetch only the metrics and segments you need.
-
Custom metrics and dimensions
Select specific fields and apply filters for targeted insights.
-
Segment filtering
Apply advanced filters to focus on user segments or traffic sources.
-
-
Scalability
Efficiently handle large datasets and multiple concurrent requests.
-
Batch requests
Group multiple queries into a single API call where supported.
-
Pagination and cursors
Fetch large result sets page by page to manage memory and network load.
-
Implementing Reporting API with PlainSignal
Step-by-step example using PlainSignal’s Reporting API for simple, cookie-free analytics.
-
Setup tracking script
Add the PlainSignal tracking snippet to your HTML to collect analytics data.
-
Installation snippet
<link rel="preconnect" href="//eu.plainsignal.com/" crossorigin /> <script defer data-do="yourwebsitedomain.com" data-id="0GQV1xmtzQQ" data-api="//eu.plainsignal.com" src="//cdn.plainsignal.com/plainsignal-min.js"></script> -
Parameter explanation
The data-do attribute sets the domain, data-id is the unique site identifier, and data-api points to the API server address.
-
-
Fetching report data
Retrieve analytics data via PlainSignal’s Reporting API endpoint.
-
Sample request
curl -X GET 'https://eu.plainsignal.com/report?start=2025-01-01&end=2025-01-07&metrics=pageviews' -H 'Authorization: Bearer YOUR_TOKEN' -
Response structure
The API returns JSON with an array of date-stamped metrics for the requested period.
-
Implementing Reporting API with Google Analytics 4 (GA4)
How to access GA4 data programmatically using Google’s Analytics Data API.
-
Authentication
Use OAuth 2.0 with service accounts to securely authenticate requests.
-
Service account setup
Create a service account in Google Cloud Console and grant it the Analytics Data Viewer role.
-
Oauth scopes
Include the
https://www.googleapis.com/auth/analytics.readonlyscope in your token.
-
-
Making a report request
Send a POST request to the GA4 Data API to run a basic report.
-
Endpoint
https://analyticsdata.googleapis.com/v1beta/properties/PROPERTY_ID:runReport -
Request body
Specify
metrics,dimensions, anddateRangesin a JSON payload.
-
-
Handling responses
Parse the JSON response for insight into user behavior.
-
Rows and headers
Match dimension headers and metric headers with row values.
-
Pagination
Use
nextPageTokento retrieve additional rows when available.
-
Best Practices
Tips to ensure efficient, reliable, and secure interactions with Reporting APIs.
-
Implement caching
Cache responses to reduce redundant API calls and improve performance.
-
Short-term caching
Cache responses in memory for frequently requested data.
-
Distributed caching
Use Redis or Memcached for cross-instance cache sharing.
-
-
Respect rate limits
Monitor and handle API quotas to avoid throttling.
-
Retry strategies
Implement exponential backoff on 429 HTTP responses.
-
Batch querying
Combine multiple data requests into batch operations where supported.
-
-
Secure endpoint access
Protect your API credentials and enforce least-privilege access.
-
Environment variables
Store secrets outside of code repositories.
-
Access controls
Limit API key or service account permissions to necessary scopes.
-
Common Pitfalls and Troubleshooting
Common challenges when working with Reporting APIs and how to resolve them.
-
Data discrepancies
API results may differ from dashboard data due to sampling or time zones.
-
Sampling
Request unsampled reports or increase sample size if supported.
-
Time zone mismatch
Ensure your queries use the same time zone settings as your reports.
-
-
Authentication errors
Failures in obtaining or using tokens can block access.
-
Invalid credentials
Verify API keys, OAuth tokens, or service account credentials.
-
Scope misconfiguration
Ensure OAuth scopes match required permissions.
-
-
Performance issues
Long response times or timeouts when fetching large datasets.
-
Large result sets
Use pagination or batch requests to divide large queries.
-
Complex filters
Simplify query filters or break them into smaller queries.
-