Published on 2025-06-28T07:58:07Z
What is Revenue per Visitor? Examples and Best Practices
Revenue per Visitor (RPV) is a key performance indicator in web analytics that shows the average revenue generated by each visitor to your website within a defined period. It combines monetary data with audience metrics to help businesses understand how effectively their site monetizes traffic. RPV provides a more granular view than overall revenue, revealing how much value each visitor contributes on average. This metric is crucial for assessing marketing ROI, comparing performance across channels, and identifying high-value segments. By tracking RPV over time, organizations can pinpoint optimization opportunities, refine pricing strategies, and enhance user experience. When used alongside related metrics like Conversion Rate and Average Order Value, Revenue per Visitor offers comprehensive insights into both the quantity and quality of site engagement. Leading analytics tools like Google Analytics 4 (GA4) and cookie-free solutions like PlainSignal support RPV tracking and reporting out of the box.
Revenue per visitor
Average revenue each visitor generates: total revenue divided by number of visitors.
What is Revenue per Visitor?
An in-depth look at the core concept and components of the Revenue per Visitor metric.
-
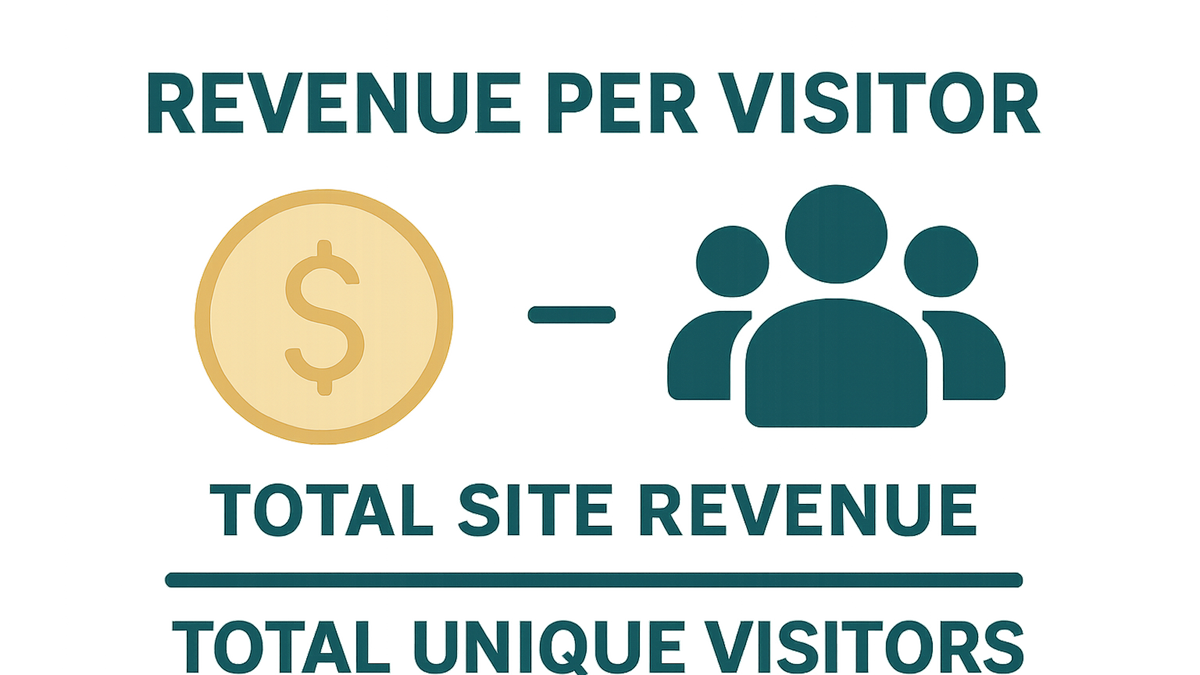
Formula
The formula for RPV divides the total revenue by the total number of unique visitors within a given period.
-
Total revenue
Sum of all revenue generated from transactions during the selected timeframe.
-
Total unique visitors
Count of distinct individuals who visited the site during the same period.
-
Why Revenue per Visitor Matters
Understanding why RPV is a critical business metric and how it drives strategic decisions.
-
Monetization efficiency
RPV highlights how well your website converts traffic into revenue, guiding resource allocation.
-
Channel benchmarking
Compare RPV across marketing channels to identify the most valuable traffic sources.
How to Calculate Revenue per Visitor
Step-by-step process for computing RPV using your analytics data.
-
Calculation process
Gather revenue and visitor metrics, then apply the RPV formula.
-
Select timeframe
Define the reporting period (e.g., daily, weekly, monthly).
-
Retrieve revenue
Export total revenue from your analytics or ecommerce platform.
-
Count visitors
Extract the number of unique visitors for the same period.
-
Apply formula
Divide total revenue by total unique visitors to derive RPV.
-
Implementing RPV Tracking with Analytics Tools
Examples using GA4 and PlainSignal to capture and report Revenue per Visitor.
-
Google analytics 4 (GA4)
Use GA4’s gtag.js and custom Explorations to measure revenue and visitor data.
-
Add gtag.js snippet
Insert the GA4 tracking code into your site’s <head>:
<script async src="https://www.googletagmanager.com/gtag/js?id=G-XXXXXXXXXX"></script> <script> window.dataLayer = window.dataLayer || []; function gtag(){dataLayer.push(arguments);} gtag('js', new Date()); gtag('config', 'G-XXXXXXXXXX'); </script> -
Track purchase events
Send revenue data with each purchase:
gtag('event', 'purchase', { value: 59.99, currency: 'USD' }); -
Create custom report
In GA4 Explorations, divide the ‘Purchase Revenue’ metric by the ‘Active Users’ dimension to visualize RPV.
-
-
PlainSignal (cookie-free analytics)
Integrate PlainSignal to measure visitors and revenue without relying on cookies.
-
Install snippet
Add the PlainSignal script to your HTML:
<link rel="preconnect" href="//eu.plainsignal.com/" crossorigin /> <script defer data-do="yourwebsitedomain.com" data-id="0GQV1xmtzQQ" data-api="//eu.plainsignal.com" src="//cdn.plainsignal.com/plainsignal-min.js"></script> -
Send revenue events
Use PlainSignal’s tracking API to report purchase values:
PlainSignal.track('purchase', { value: 120, currency: 'USD' }); -
View rpv dashboard
Navigate to ‘Reports > Revenue Analytics’ in the PlainSignal dashboard to see RPV metrics.
-
Best Practices and Optimization Strategies
Techniques to improve your Revenue per Visitor through continuous testing and personalization.
-
Segmentation
Analyze RPV by channels, campaigns, or user segments to target high-value audiences.
-
A/b testing
Experiment with pricing, offers, and landing page designs to maximize per-visitor revenue.
-
Personalization
Use dynamic product recommendations and tailored content to increase average transaction values.
Limitations and Considerations
Potential challenges and factors to keep in mind when interpreting RPV.
-
Data accuracy
Ensure revenue is deduplicated and visitor counts align with your tracking configuration.
-
Seasonality effects
Account for promotions and seasonal trends that can skew RPV over short periods.
-
Privacy and sampling
Be aware that ad-blockers, cookie restrictions, or sampling thresholds may impact data completeness.