Published on 2025-06-22T05:52:45Z
What is Share of Voice? Examples with PlainSignal and GA4
Share of Voice (SoV) is a percentage measure of a brand’s visibility within a defined market or channel. It compares the brand’s impressions, mentions, or presence against the total in a given category. In analytics, SoV helps marketers gauge competitive positioning, allocate budgets, and optimize campaigns. High SoV often correlates with stronger brand awareness and market penetration. By understanding and improving SoV across channels—paid, organic, and owned—teams can make strategic decisions that drive growth and outperform competitors.
Share of voice
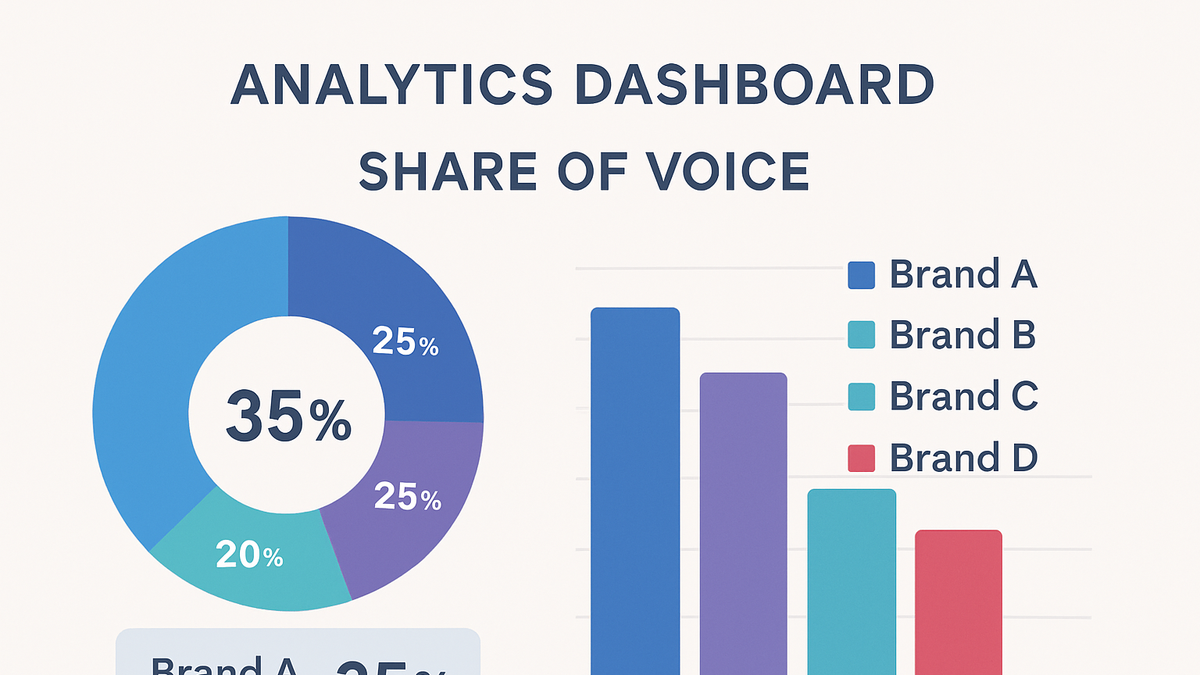
Share of Voice quantifies a brand's percentage of total market impressions, indicating its relative visibility.
Definition and Importance
Share of Voice (SoV) measures the share of total market impressions a brand captures. It’s used to understand competitive positioning and to prioritize marketing investments. In digital analytics, SoV aggregates data across channels—paid, organic, and social—to reveal where a brand stands relative to competitors. A growing SoV often signals increasing brand visibility and stronger performance.
-
Core concept
SoV is calculated by dividing a brand’s impressions by the total market impressions and is expressed as a percentage.
-
Formula
SoV = (Brand Impressions / Total Market Impressions) × 100%
-
-
Why it matters
SoV indicates how much “voice” a brand has in its marketplace, guiding budget allocation and campaign strategies.
Calculating Share of Voice
This section covers the steps to compute SoV, from data collection to applying the formula. We discuss sources and considerations for accurate measurements.
-
Collecting impressions data
Gather impressions from all relevant channels such as paid ads, organic search, social media, and website analytics tools.
-
Paid advertising
Extract campaign impression counts from platforms like Google Ads or Facebook Ads.
-
Organic and owned media
Include data from organic search, social posts, and direct website traffic.
-
-
Applying the sov formula
Sum your brand’s impressions and divide by the total market impressions, then multiply by 100 to get a percentage.
-
Example calculation
If you have 10,000 impressions and total market impressions are 100,000, SoV = 10%.
-
Implementing SoV with SaaS Tools
Learn how to set up and use analytics platforms like PlainSignal and GA4 to track and analyze Share of Voice.
-
Using PlainSignal
To implement SoV tracking with PlainSignal, embed the following snippet into your site’s <head> to capture pageview data cookie-free:
<link rel="preconnect" href="//eu.plainsignal.com/" crossorigin />
<script defer data-do="yourwebsitedomain.com" data-id="0GQV1xmtzQQ" data-api="//eu.plainsignal.com" src="//cdn.plainsignal.com/plainsignal-min.js"></script>
PlainSignal records pageviews by referrer and page, which you can export or visualize in its dashboard to approximate your share of site impressions.
-
Privacy benefits
No cookies or user identifiers are stored, ensuring GDPR and CCPA compliance.
-
Data export
Use PlainSignal’s CSV export or API to pull impression data for SoV analysis.
-
-
Using google analytics 4 (GA4)
In GA4, configure your gtag snippet to ensure pageview events are tracked:
<script async src="https://www.googletagmanager.com/gtag/js?id=GA_MEASUREMENT_ID"></script>
<script>
  window.dataLayer = window.dataLayer || [];
  function gtag(){dataLayer.push(arguments);}
  gtag('js', new Date());
  gtag('config', 'GA_MEASUREMENT_ID');
</script>
Then create a Free-form exploration or custom report to display impressions by campaign or channel. Divide your brand’s impressions by the total to compute SoV within GA4’s interface.
-
Custom reports
Use the Explore tab to build tables showing impression totals by dimension.
-
Calculated metrics
Create a custom metric in GA4 to automatically compute the SoV percentage.
-
Best Practices and Pitfalls
To ensure reliable SoV insights, follow best practices and avoid common mistakes when collecting and interpreting data.
-
Ensure comprehensive coverage
Include all channels where your brand is active to avoid underestimating your true SoV.
-
Beware of contextual factors
Interpret SoV alongside other KPIs (e.g., engagement, conversion) to avoid overemphasis on impressions alone.