Published on 2025-06-28T06:36:26Z
What is Slice-and-Dice in Analytics? Examples with PlainSignal and GA4
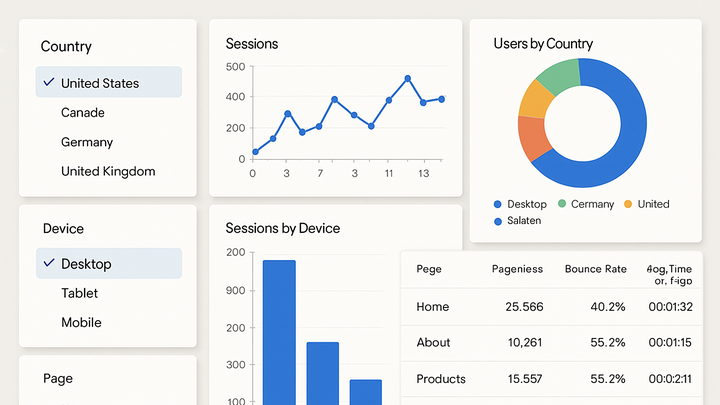
Slice-and-dice is a core analytics operation that lets you break down large datasets into smaller, more meaningful pieces by selecting specific dimensions and metrics. Originating from OLAP (Online Analytical Processing) cubes, slicing fixes a single dimension (e.g., page = “/home”), while dicing selects multiple dimensions at once (e.g., page + browser) to create a multi-dimensional subcube. This technique empowers analysts to explore user behavior, traffic patterns, and conversion funnels from different perspectives. By interactively filtering and pivoting, you uncover hidden insights, compare segments side-by-side, and drive data-informed decisions. Both PlainSignal and Google Analytics 4 provide interfaces and APIs to perform slice-and-dice operations seamlessly.
Slice-and-dice
Breaking analytics data into subsets by dimensions and metrics for deeper insights.
Understanding Slice-and-Dice
Slice-and-dice is one of the two fundamental OLAP operations (the other being drill-down). It allows analysts to extract specific cross-sections of a multi-dimensional dataset by choosing one or more dimensions and one or more metrics. This gives a granular view of performance across different categories, time periods, or user groups.
-
Slicing vs. dicing
Slicing narrows data by fixing a single dimension to one value, while dicing selects two or more dimensions to form a smaller, multi-dimensional subcube.
-
Slice
A slice fixes one dimension (e.g., all pageviews for the “/pricing” page) and returns metrics for that subset.
-
Dice
A dice picks multiple dimensions (e.g., page + browser) to return a grid of metrics showing every combination.
-
-
Origins in olap
Slice-and-dice emerged in OLAP systems to enable rapid, ad-hoc querying of data cubes for business intelligence and reporting.
-
Olap cube
A multi-dimensional array of data organized by dimensions (e.g., time, product, region) and measures (e.g., sales, views).
-
Implementing Slice-and-Dice in PlainSignal
PlainSignal offers a lightweight, cookie-free analytics solution that supports dimensional filtering and multi-dimensional queries via its dashboard and REST API. After embedding the tracking snippet, you can slice your traffic by page, referrer, country, device, and more.
-
Embedding the PlainSignal snippet
Install PlainSignal on every page to start collecting data for slicing and dicing.
-
Tracking code
<link rel="preconnect" href="//eu.plainsignal.com/" crossorigin />
<script defer data-do="yourwebsitedomain.com" data-id="0GQV1xmtzQQ" data-api="//eu.plainsignal.com" src="//cdn.plainsignal.com/plainsignal-min.js"></script>
-
-
Filtering data by dimension
Use the PlainSignal dashboard or API parameters to apply filters on dimensions like page, country, or referrer to slice your dataset.
-
Constructing multi-dimensional queries
Leverage the PlainSignal REST API to request multiple dimensions at once and dice your data for detailed cross-analysis.
-
Sample api call
GET https://eu.plainsignal.com/api/data?dimensions=page,browser&metrics=views
-
Leveraging Slice-and-Dice in Google Analytics 4
Google Analytics 4 (GA4) provides the Explorations workspace and custom reports for advanced slice-and-dice analysis. You can drag and drop dimensions and metrics, define segments, and compare slices side by side.
-
Explorations canvas
In GA4 Explorations, add ‘Rows’ (dimensions) and ‘Values’ (metrics), then apply filters or segments to slice-and-dice your data interactively.
-
Dimension breakdowns
Add dimensions like ‘city’ or ‘device category’ under ‘Rows’ to see how metrics like users or events distribute across them.
-
-
Custom segments
Define user segments (e.g., mobile purchasers, first-time visitors) and apply them as filters in Explorations to compare different slices.
-
Creating a segment
In Explorations, click ‘SEGMENTS’, then ‘New segment’, choose criteria, save, and apply.
-
-
Custom reports
Use the Report Library to build tables and charts combining multiple dimensions and metrics for a pre-built slice-and-dice view.
Best Practices for Effective Slice-and-Dice
While slice-and-dice unlocks powerful insights, overuse or poor planning can lead to confusion and performance slowdowns. Follow these guidelines to keep your analysis clear and efficient.
-
Limit the number of dimensions
Too many dimensions can overwhelm your dashboard and slow query performance. Start with 2–3 core dimensions.
-
Use meaningful dimensions
Select dimensions that align with business goals (e.g., campaign source, user type, region) to drive actionable insights.
-
Combine slicing with drill-down
After slicing, use drill-down to explore a subset hierarchically (e.g., Country → State → City) for deeper context.
-
Maintain consistent naming conventions
Standardize dimension and metric names across reports to avoid confusion and ensure comparable slices.
