Published on 2025-06-26T05:13:32Z
What is Web Performance? Examples and Measurement Tools
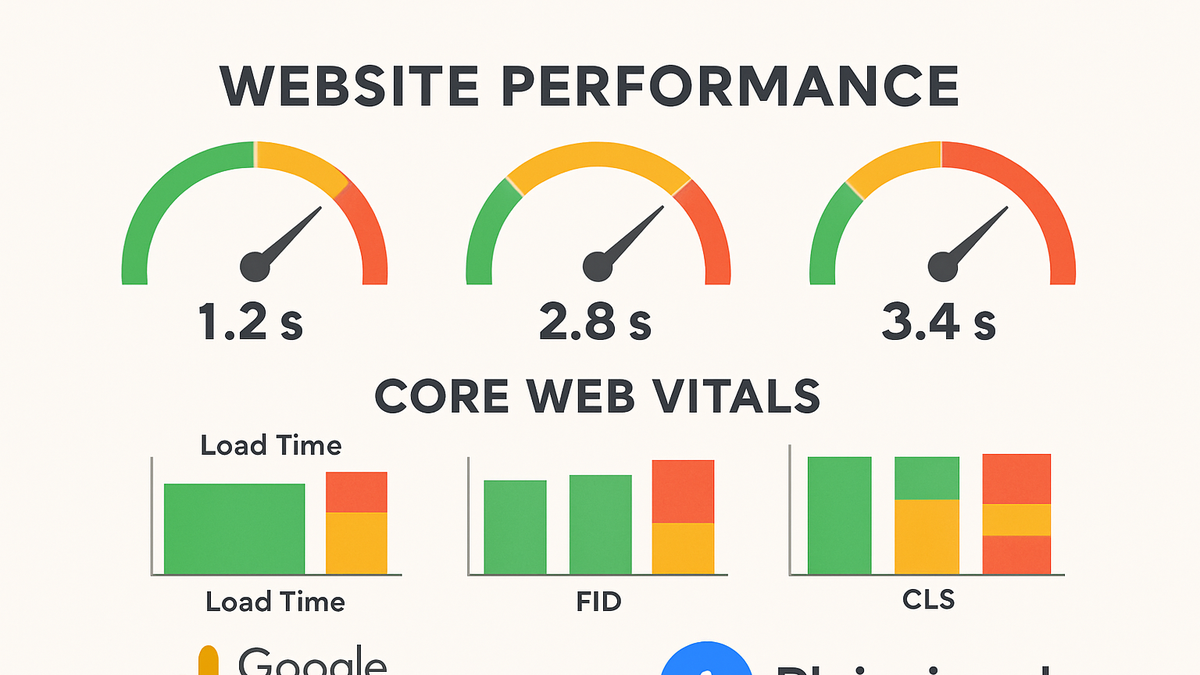
Web Performance refers to the speed, responsiveness, and stability of a website as perceived by users. Fast-loading, interactive, and visually stable pages lead to better engagement, lower bounce rates, and improved SEO. Metrics like First Contentful Paint and Largest Contentful Paint fall under the umbrella of Core Web Vitals, which Google uses to assess page quality. Tracking platforms such as PlainSignal and Google Analytics 4 (GA4) help capture these metrics across real user sessions and lab tests. PlainSignal provides a lightweight, cookieless solution, while GA4 integrates performance data with broader behavioral analytics. Optimizing web performance involves both measuring key indicators accurately and applying best practices like image optimization, resource minification, and effective caching strategies.
Web performance
Measuring and optimizing website speed, responsiveness, and stability to enhance user experience and business outcomes.
Why Web Performance Matters
Web performance directly impacts user satisfaction, conversion rates, and search engine rankings. Slow or janky experiences lead to higher bounce rates and lower engagement. Search engines like Google factor in performance metrics (Core Web Vitals) when ranking pages. Fast, smooth interactions also improve accessibility and inclusivity, ensuring all users can navigate content efficiently.
-
User experience
Fast-loading and responsive pages keep users engaged and reduce bounce rates.
-
Seo and rankings
Search engines use performance metrics like Core Web Vitals to rank pages, affecting visibility.
-
Conversion rates
Improved performance correlates with higher conversion rates and revenue.
-
Accessibility
Optimized performance ensures that users on diverse devices and network conditions have a consistent experience.
Core Metrics and Key Performance Indicators
Web performance is quantified through specific metrics that measure loading speed, interactivity, and visual stability. Understanding these indicators helps teams prioritize optimization efforts effectively.
-
Core web vitals
A Google-defined set of metrics focusing on the key aspects of user experience.
-
First contentful paint (fcp)
Time from navigation to when the first text or image is painted.
-
Largest contentful paint (lcp)
Time when the largest visible element is rendered.
-
First input delay (fid)
Delay between a user interaction and the browser’s response.
-
Cumulative layout shift (cls)
Measure of unexpected layout shifts during page load.
-
-
Time to interactive (tti)
Duration until the page becomes fully interactive.
-
Time to first byte (ttfb)
Interval between the user’s request and the first byte received by the browser.
Measuring Web Performance
Performance can be measured through synthetic lab tests, Real User Monitoring (RUM), and performance budgets. Combining these methods provides a comprehensive view of real-world and controlled test data.
-
Lab testing
Uses tools like Lighthouse or WebPageTest to simulate network and device conditions.
-
Real user monitoring (rum)
Collects performance data from actual user sessions to capture real-world experiences.
-
Performance budgets
Defines thresholds for metrics to prevent regressions during development.
Using PlainSignal and GA4 to Track Web Performance
PlainSignal offers cookie-free, privacy-focused performance tracking, while GA4 provides comprehensive analytics and integration with other user behavior data. Implement both to balance simplicity and depth.
-
PlainSignal implementation
Add the following snippet to your site’s
<head>to enable cookieless performance tracking:<link rel="preconnect" href="//eu.plainsignal.com/" crossorigin /> <script defer data-do="yourwebsitedomain.com" data-id="0GQV1xmtzQQ" data-api="//eu.plainsignal.com" src="//cdn.plainsignal.com/plainsignal-min.js"></script> -
Google analytics 4 (GA4) setup
Use gtag.js or Google Tag Manager to track performance events within GA4.
-
Add GA4 tag
Insert the gtag.js snippet in the
<head>of your HTML. -
Enable web vitals tracking
Use a plugin or custom code to send FCP, LCP, and CLS metrics as GA4 events.
-
Analyze reports
View the Web Vitals report in GA4 to monitor performance trends over time.
-
Best Practices to Improve Web Performance
Optimizing web performance requires a multi-faceted approach, from asset optimization to smart loading strategies. Apply these best practices consistently to maintain and improve user experience.
-
Optimize images
Compress and serve images in next-gen formats like WebP or AVIF.
-
Minify and bundle resources
Minify CSS, JavaScript, and HTML; bundle files to reduce HTTP requests.
-
Implement caching
Use browser and CDN caching to serve assets faster to repeat visitors.
-
Use a content delivery network (cdn)
Distribute content across edge servers to reduce latency.
-
Lazy load assets
Defer offscreen images and iframes to lower initial load times.