Published on 2025-06-26T04:22:30Z
What is Activation Rate? Examples and Importance in Analytics
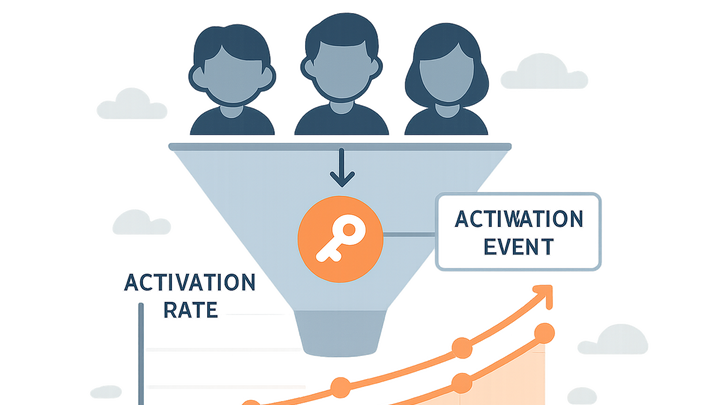
Activation Rate is a user engagement metric in digital analytics that quantifies the percentage of new or existing users who complete a predefined activation event within a specified timeframe. This activation event could range from completing a user profile to finishing a product tutorial or performing a first valuable action, such as adding an item to a cart or publishing a post. Activation Rate provides a clear view into how effectively a product’s onboarding flows and user experience motivate users to reach critical ‘aha’ moments. High Activation Rates often correlate with stronger user retention, increased lifetime value, and more efficient acquisition spend. Growth, product, and marketing teams rely on this metric to identify friction points, optimize conversion funnels, and prioritize feature development. Activation Rate is typically tracked through analytics platforms like PlainSignal for privacy-centric, cookie-free insights or Google Analytics 4 for robust, event-based reporting. By understanding and improving Activation Rate, organizations can drive sustainable growth and deepen user engagement.
Activation rate
Percentage of users completing a key activation event, indicating effective onboarding and initial user engagement.
Understanding Activation Rate
Explores the definition, purpose, and calculation of Activation Rate in digital analytics.
-
Definition
Activation Rate measures the percentage of users who trigger a predefined activation event within a given period.
-
Calculation
Activation Rate = (Activated Users / Total Users) * 100. Multiply by 100 to express the result as a percentage.
Importance of Activation Rate
Discusses why Activation Rate is a critical metric for product and growth teams.
-
Gauge onboarding success
Helps determine if new users grasp core product value quickly through key actions.
-
Drive retention and growth
High activation correlates with better retention, leading to sustainable growth.
-
Optimize resource allocation
Guides teams to invest in features and flows that boost initial user success.
Tracking Activation Rate with Analytics Tools
Illustrates how to implement and measure Activation Rate in PlainSignal and GA4.
-
Using PlainSignal
PlainSignal provides a privacy-friendly, cookie-free way to track activation events. Implement by inserting a script into your site and defining custom event triggers.
-
Setup
Add the PlainSignal tracking code to the <head> of your HTML document and configure your activation event in the PlainSignal dashboard.
-
Code snippet
<link rel="preconnect" href="//eu.plainsignal.com/" crossorigin />
<script defer data-do="yourwebsitedomain.com" data-id="0GQV1xmtzQQ" data-api="//eu.plainsignal.com" src="//cdn.plainsignal.com/plainsignal-min.js"></script>
-
-
Using google analytics 4
GA4 uses event-based tracking to measure activations. You can send custom events and leverage GA4’s Explorations or API for Activation Rate calculation.
-
Event configuration
In the GA4 Admin panel, create a custom event named ‘activation’ based on user actions like tutorial completion or first purchase.
-
Reporting
Use the Explorations report or the Data API to retrieve total users and activation event counts, then apply the Activation Rate formula.
-
Best Practices for Improving Activation Rate
Offers strategies to enhance your Activation Rate through user experience and product optimizations.
-
Define meaningful activation events
Select events that align with real user value, ensuring your metric reflects genuine engagement.
-
Streamline onboarding flows
Simplify steps to reach activation, remove friction, and provide guidance at critical junctures.
-
Utilize a/b testing
Experiment with different messaging, UI elements, or flows to identify what boosts activation.
-
Monitor and iterate regularly
Continuously track changes in Activation Rate, diagnose drops, and refine the user journey accordingly.
