Published on 2025-06-22T05:04:26Z
What is Retention Rate? Examples for Retention Rate
Retention Rate is a key performance indicator in analytics that quantifies the proportion of users who continue to engage with a product, service, or website over a given timeframe. It helps businesses understand user loyalty, satisfaction, and the effectiveness of their engagement strategies. A high retention rate typically correlates with strong user experience and product-market fit, whereas a declining rate can indicate issues that may lead to churn. This metric is usually expressed as a percentage and can be calculated for various periods (e.g., daily, weekly, monthly). Tracking retention rate enables data-driven decisions around marketing, product development, and customer success initiatives, ultimately driving sustainable growth.
Retention rate
Percentage of users who return after their first visit, measuring user engagement over time.
Definition and Importance
This section covers what retention rate is and why it’s a key metric in analytics for measuring user loyalty and engagement over time.
-
What is retention rate?
Retention Rate measures the percentage of users who return to your product or website after their first visit, indicating your ability to engage and retain customers over time.
-
Why retention rate matters
A high retention rate suggests strong product-market fit and user satisfaction, reducing acquisition costs and increasing customer lifetime value. It helps identify growth opportunities and potential churn risks.
Calculation Method
Learn how to calculate retention rate accurately to assess user engagement over a specified time period.
-
Retention rate formula
Calculate Retention Rate by dividing the number of retained users by the total number of users at the start of the period, then multiplying by 100%.
Retention Rate = (Retained Users / Total Users) × 100
-
Retained users
Users who returned to your site or app at least once during the specified period.
-
Total users
Users who first visited your site or app at the beginning of the time period.
-
Practical Applications
Explore real-world scenarios where retention rate insights drive business decisions and growth strategies.
-
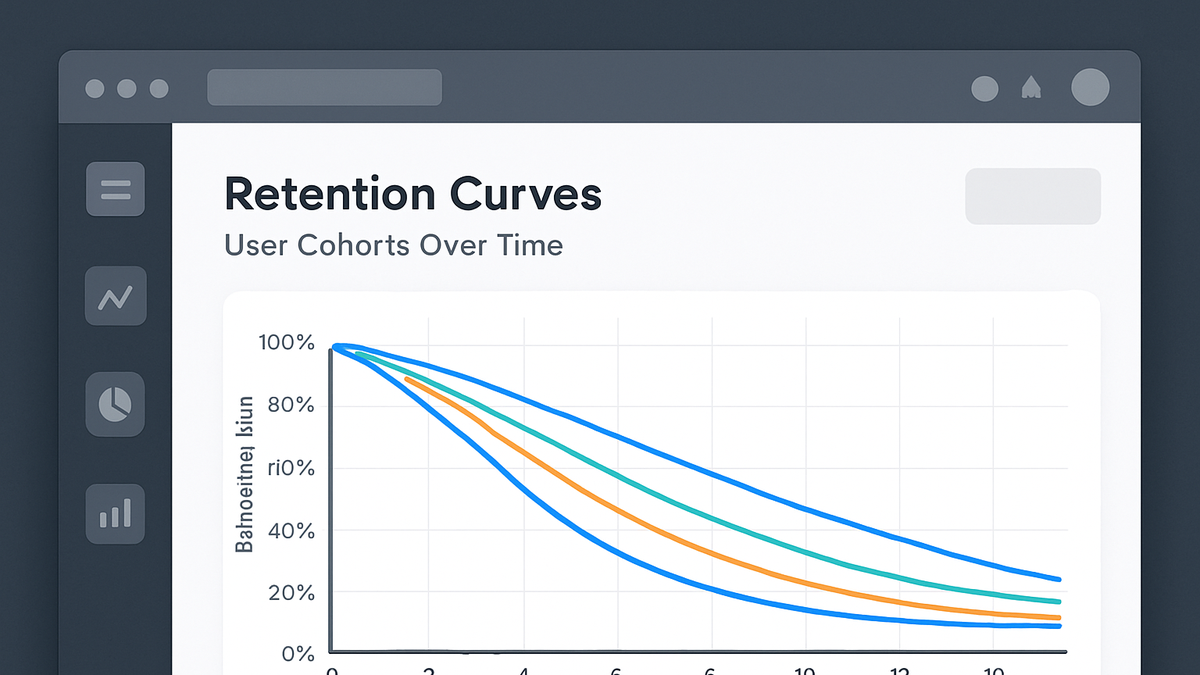
Cohort analysis
Segment users by acquisition date to compare retention patterns across different cohorts and identify trends over time.
-
Product usage optimization
Use retention data to refine features and UX flows that encourage users to return and engage more frequently.
-
Marketing roi assessment
Evaluate the long-term impact of marketing campaigns by measuring the retention of users acquired through specific channels.
Tracking Retention Rate with SaaS Tools
Implementation examples for tracking retention rate using PlainSignal and Google Analytics 4.
-
PlainSignal (cookie-free analytics)
PlainSignal offers a lightweight, privacy-focused analytics solution. To integrate, add the following script to your site’s head:
-
Installation snippet
<link rel="preconnect" href="//eu.plainsignal.com/" crossorigin /> <script defer data-do="yourwebsitedomain.com" data-id="0GQV1xmtzQQ" data-api="//eu.plainsignal.com" src="//cdn.plainsignal.com/plainsignal-min.js"></script> -
Viewing retention reports
Navigate to the PlainSignal dashboard and select Retention under Reports to see returning user metrics over custom periods.
-
-
Google analytics 4 (GA4)
GA4 tracks retention automatically using built-in user retention reports. Ensure your GA4 property is properly configured to capture user identifiers.
-
Enable google signals
In GA4 Admin > Data Settings > Data Collection, enable Google Signals to track cross-device user behavior.
-
Access retention report
Go to Reports > Life cycle > Retention to view retention curves, user cohorts, and retention metrics.
-