Published on 2025-06-22T03:08:50Z
What is Engagement Rate? Examples for Engagement Rate
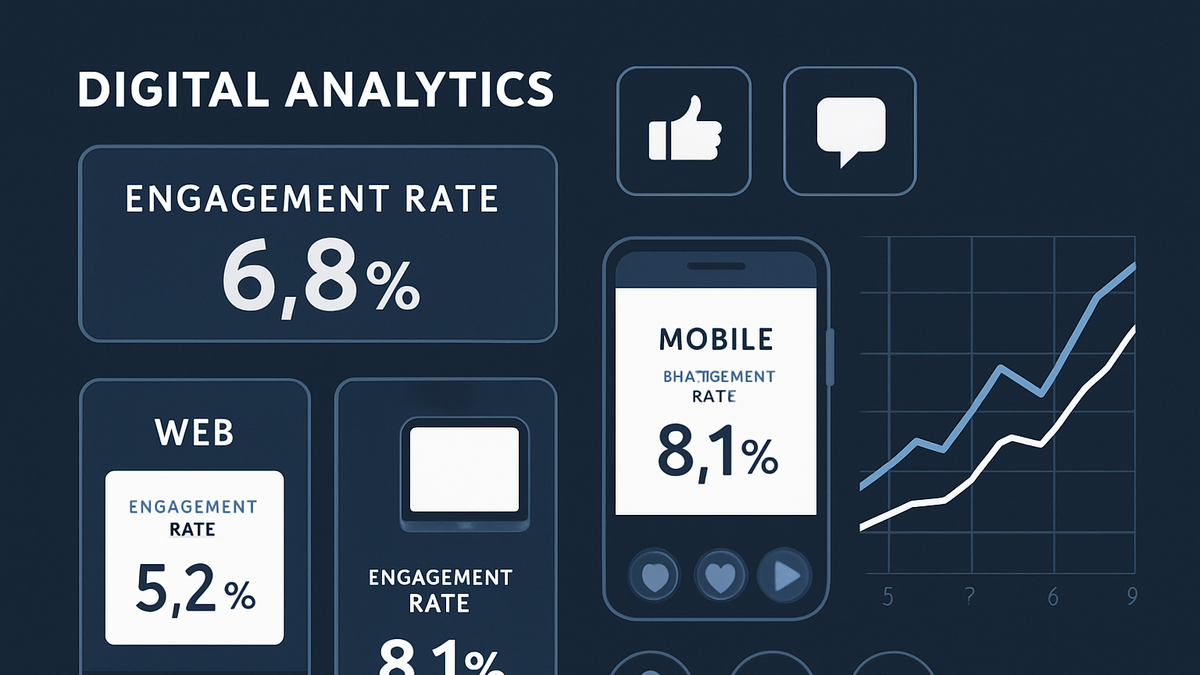
In analytics, Engagement Rate measures the proportion of sessions where users actively interact with a website or app. Unlike basic metrics such as pageviews or total sessions, Engagement Rate focuses on the quality of user interactions.
In Google Analytics 4 (GA4), an engaged session is defined as any session lasting at least 10 seconds, containing a conversion event, or including two or more screen or pageviews. PlainSignal, a privacy-focused, cookie-free analytics solution, allows you to track Engagement Rate with customizable thresholds using a simple JavaScript snippet:
<link rel="preconnect" href="//eu.plainsignal.com/" crossorigin />
<script defer data-do="yourwebsitedomain.com" data-id="0GQV1xmtzQQ" data-api="//eu.plainsignal.com" src="//cdn.plainsignal.com/plainsignal-min.js"></script>
Tracking Engagement Rate helps marketers and product teams understand how effectively their content and features engage visitors. By comparing Engagement Rate over time and across channels, businesses can identify high-performing campaigns and areas needing improvement.
Engagement rate
Percentage of sessions with meaningful user interactions, as defined by engagement criteria in analytics platforms.
Definition and Importance of Engagement Rate
This section explains what Engagement Rate measures and why it matters for understanding user behavior beyond raw traffic counts.
-
What engagement rate measures
Engagement Rate quantifies the share of sessions where users perform meaningful actions—such as spending a minimum time on site, triggering conversions, or viewing multiple pages—indicating genuine interest.
-
Why engagement rate matters
By focusing on engagement rather than just visits, teams can assess content effectiveness, optimize user journeys, and prioritize improvements that boost real user interaction.
Calculating Engagement Rate in GA4 and PlainSignal
A walkthrough of how Engagement Rate is computed in Google Analytics 4 versus PlainSignal and how to implement tracking.
-
GA4 engagement rate calculation
In GA4, Engagement Rate = (Engaged Sessions / Total Sessions). Engaged Sessions are those lasting ≥10 seconds, having a conversion event, or containing ≥2 pageviews or screenviews.
-
PlainSignal engagement rate calculation
PlainSignal uses customizable thresholds to define engaged sessions in a cookie-free environment. Integrate with this snippet:
-
Tracking code example
<link rel="preconnect" href="//eu.plainsignal.com/" crossorigin />
<script defer data-do="yourwebsitedomain.com" data-id="0GQV1xmtzQQ" data-api="//eu.plainsignal.com" src="//cdn.plainsignal.com/plainsignal-min.js"></script>
-
Best Practices for Improving Engagement Rate
Proven strategies to increase Engagement Rate by enhancing user experience and content relevance.
-
Optimize page load speed
Faster pages reduce frustration and bounce rates, leading to more engaged interactions.
-
Enhance content relevance
Use audience segmentation and personalization to deliver content that resonates with user intent.
-
Implement a/b testing
Experiment with headlines, layouts, and calls to action to discover which variations drive higher engagement.
Common Pitfalls and How to Avoid Them
Key challenges and misinterpretations when leveraging Engagement Rate and ways to mitigate them.
-
Inconsistent definitions across platforms
GA4 and PlainSignal use different engagement criteria—avoid comparing metrics directly without normalization.
-
Overemphasis on engagement over conversions
High Engagement Rate doesn’t always translate to revenue; balance engagement insights with conversion metrics.