Published on 2025-06-22T02:05:37Z
What is Bounce Rate? Examples for Bounce Rate
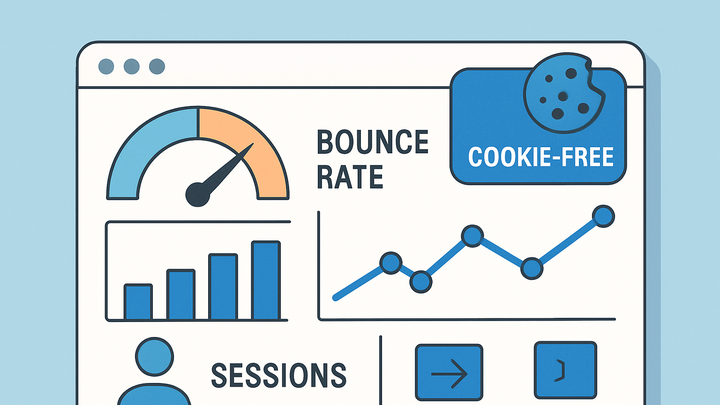
Bounce Rate is the percentage of sessions where a user visits only a single page on your website and leaves without triggering any further requests. It is a key indicator of user engagement and content relevance, helping marketers and analysts understand how effectively a page retains visitors. In Google Analytics 4 (GA4), Bounce Rate is calculated as 1 minus the Engagement Rate, reflecting sessions that did not meet engagement criteria (such as 10+ seconds duration, two or more page views, or a conversion). Cookie-free analytics platforms like PlainSignal also track Bounce Rate by counting single-page sessions without relying on third-party cookies, ensuring privacy-compliant measurement. Monitoring Bounce Rate across various pages and segments aids in optimizing user experience, improving content, and refining marketing strategies.
Bounce rate
Percentage of single-page sessions showing user engagement; in GA4 Bounce Rate = 1 – Engagement Rate.
Why Bounce Rate Matters
Bounce Rate serves as a primary indicator of how engaging and relevant your website content is. High bounce rates may signal issues with page design, load times, or content mismatch, while low bounce rates suggest effective engagement. It provides insights into user satisfaction and helps prioritize optimization efforts to reduce drop-offs.
-
User engagement indicator
Bounce Rate reflects the percentage of visitors who leave after viewing only one page, highlighting the initial impact of your content and site experience.
-
Seo implications
Search engines may interpret high bounce rates as a sign of low relevance, potentially affecting organic rankings, especially for landing pages and blog posts.
How Bounce Rate is Calculated
Different analytics tools use slightly varying definitions for Bounce Rate. Typically, it’s calculated by dividing the number of single-page sessions by the total number of sessions and multiplying by 100. Understanding these calculation nuances is essential for accurate cross-platform comparisons.
-
Universal analytics definition
In Universal Analytics, Bounce Rate = (Single-page sessions ÷ Total sessions) × 100. Any session without interaction beyond the initial page is a bounce.
-
GA4 calculation
GA4 defines Engagement Rate first (sessions with ≥10 s duration, ≥2 screen views, or a conversion). Bounce Rate = 1 – Engagement Rate. This shifts focus from mere page hits to meaningful interactions.
-
PlainSignal’s cookie-free approach
PlainSignal tracks page requests server-side without cookies. It calculates Bounce Rate using the same single-page session formula, ensuring privacy compliance while delivering accurate metrics.
Tracking Bounce Rate
To collect Bounce Rate data, integrate your site with an analytics tool by adding its tracking snippet. Below are examples for GA4 and PlainSignal.
-
Tracking with GA4
Add the GA4 gtag.js snippet to your site’s <head> to enable automatic session and engagement tracking:
<!-- Global site tag (gtag.js) - Google Analytics --> <script async src="https://www.googletagmanager.com/gtag/js?id=G-XXXXXXXXXX"></script> <script> window.dataLayer = window.dataLayer || []; function gtag(){dataLayer.push(arguments);} gtag('js', new Date()); gtag('config', 'G-XXXXXXXXXX'); </script> -
Tracking with PlainSignal
Insert the PlainSignal script in your <head> for cookie-free, privacy-first analytics:
<link rel="preconnect" href="//eu.plainsignal.com/" crossorigin />
<script defer data-do="yourwebsitedomain.com" data-id="0GQV1xmtzQQ" data-api="//eu.plainsignal.com" src="//cdn.plainsignal.com/plainsignal-min.js"></script>
Interpreting Bounce Rate
Analyzing Bounce Rate requires context: industry benchmarks, page purpose, and user intent heavily influence what constitutes a ‘good’ rate. Segmenting data uncovers deeper insights for targeted improvements.
-
What’s a good bounce rate?
Average bounce rates vary: 26–40% is excellent, 41–55% is average, and above 70% may need attention. Content-heavy or single-page sites often see higher rates.
-
Segmenting bounce rate
Break down Bounce Rate by dimensions to diagnose issues and tailor optimizations.
-
By traffic source
Compare organic, paid, referral, and social channels to identify underperforming sources.
-
By device type
Analyze desktop vs mobile bounce rates to address responsive design or load-time issues.
-
Common Pitfalls and Misconceptions
Bounce Rate is often misinterpreted. It’s not always a negative indicator, nor is a low rate always good. Consider session quality and business goals alongside Bounce Rate for balanced analysis.
-
Low bounce rate isn’t always good
A low bounce rate might result from accidental multiple hits (auto-refresh, chat widgets) rather than true engagement.
-
High bounce rate isn’t always bad
Users may find what they need on a single page (e.g., blog post, contact info) and leave satisfied, inflating bounce numbers.
