Published on 2025-06-22T02:12:29Z
What is Churn Rate? Examples of Churn Rate in Analytics
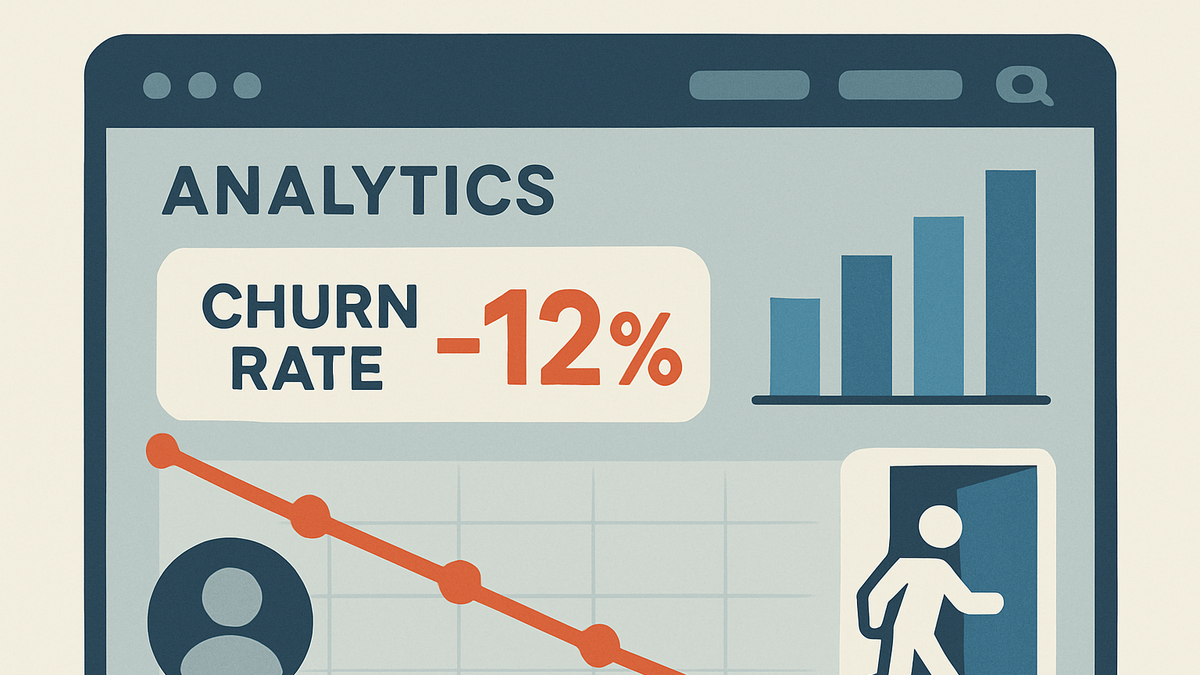
Churn Rate is a key metric in analytics that measures the percentage of customers or users who stop using a product or service over a defined period. It reflects the loss of active users and directly impacts revenue, growth forecasts, and customer lifetime value. By tracking churn, businesses can identify patterns in user departures, assess the effectiveness of retention strategies, and prioritize improvements. In analytics platforms like PlainSignal (cookie-free simple analytics) and Google Analytics 4 (GA4), churn rate can be calculated through cohort analysis and custom event tracking. Understanding churn not only highlights areas for product enhancement but also guides marketing and customer success teams in reducing attrition. High churn rates may signal issues with onboarding, user experience, or product–market fit, whereas low churn indicates strong user engagement and satisfaction. Regularly monitoring churn with the tools and code examples below equips teams to make data-driven decisions for sustainable growth.
Churn rate
Metric measuring the percentage of users who stop using a product or service over a period, revealing customer retention health.
Why Churn Rate Matters
Churn rate offers critical insights into business health, revenue forecasting, and user satisfaction. A rising churn rate can indicate product issues, while a stable or decreasing churn rate suggests effective retention strategies. Monitoring churn helps allocate resources to improve onboarding, product features, and support. It also underpins strategic decisions in marketing budgets and growth initiatives.
-
Revenue forecasting
Churn directly affects recurring revenue projections by predicting future losses. Understanding churn helps finance teams refine revenue forecasts and budgeting.
-
Customer lifetime value
Lower churn extends customer lifespan, increasing lifetime value (LTV). Companies can invest more in acquisition when LTV is high relative to acquisition costs.
-
Product improvement
By analyzing customer exit points, product teams can identify pain points, feature gaps, and areas for enhancement to reduce churn.
How to Calculate Churn Rate
Calculating churn rate involves dividing the number of churned customers by the number of customers at the beginning of the period. While simple in concept, nuances such as subscription upgrades, downgrades, and reactivations can affect accuracy. Different definitions (customer churn vs revenue churn) also yield different perspectives.
-
Basic formula
Churn Rate = (Number of customers lost during period) / (Number of customers at period start) × 100. Use this for a straightforward view of customer attrition.
-
Revenue churn
Revenue churn measures revenue lost from existing customers, calculated as (Beginning MRR – MRR at period end) / Beginning MRR × 100. This accounts for downgrades and upgrades.
-
Net vs gross churn
Gross churn counts only lost revenue, while net churn factors in expansion revenue from existing customers, giving a fuller picture.
Example Implementations
Below are examples of how to track churn rate in two popular analytics platforms: PlainSignal and Google Analytics 4 (GA4). These examples include code snippets and setup steps to collect relevant data.
-
PlainSignal (cookie-free simple analytics)
With PlainSignal, you can track user sessions and custom churn events without cookies. Implement the following snippet on your pages to begin collecting data:
-
Tracking code
<link rel="preconnect" href="//eu.plainsignal.com/" crossorigin /> <script defer data-do="yourwebsitedomain.com" data-id="0GQV1xmtzQQ" data-api="//eu.plainsignal.com" src="//cdn.plainsignal.com/plainsignal-min.js"></script> -
Custom event tracking
Use PlainSignal’s API to define events when users cancel or become inactive, then analyze cohorts to derive churn.
-
Privacy compliance
PlainSignal’s cookie-free model ensures GDPR compliance while providing essential churn metrics.
-
-
Google analytics 4 (GA4)
GA4 doesn’t provide a direct churn metric out of the box but you can approximate churn using retention and custom events.
-
User-id setup
Enable User-ID tracking to unify sessions across devices, improving churn calculations.
-
Retention reports
Navigate to the Analysis Hub > Retention to view user cohorts and retention curves; churn exists where retention dips.
-
Custom definitions
Create custom events for subscription cancellations and use Explorations to calculate churn rate.
-
Strategies to Reduce Churn
Reducing churn requires a holistic approach across product, marketing, and customer success. Key strategies include improving onboarding, enhancing engagement, and fostering feedback loops.
-
Improve onboarding
Guide new users through core features with tutorials and tooltips to help them realize value quickly.
-
Guided tours
Implement interactive walkthroughs to highlight important features.
-
Welcome emails
Send targeted email sequences to educate and engage new users.
-
-
Enhance product engagement
Encourage regular use by personalizing content, sending usage reminders, and optimizing key workflows.
-
Personalized dashboards
Allow users to customize their dashboard for a relevant experience.
-
Feature highlights
Notify users of underused features that can boost their ROI.
-
-
Feedback loops
Collect qualitative feedback to understand exit reasons and address friction points.
-
Surveys & nps
Deploy in-app or email surveys to measure satisfaction.
-
Support channels
Offer live chat or dedicated support to resolve issues promptly.
-
Best Practices & Common Pitfalls
When working with churn data, follow these best practices and avoid common mistakes to get accurate insights and actionable recommendations.
-
Segment your churn
Analyze churn by subscription tier, geography, or user cohort to identify patterns. Averages can hide critical issues.
-
Account for seasonal trends
Adjust for expected seasonal fluctuations in user behavior to avoid misinterpreting churn spikes.
-
Validate with multiple data sources
Cross-check churn figures between analytics tools (e.g., PlainSignal vs GA4) and CRM systems to ensure data accuracy.