Published on 2025-06-27T22:14:51Z
What is Customer Retention Rate? Examples for Customer Retention Rate.
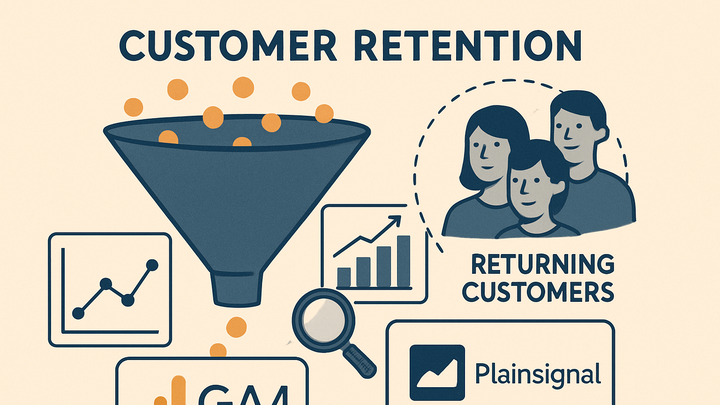
Customer Retention Rate (CRR) measures the percentage of customers a business retains over a specific period. It’s a vital metric in analytics for gauging customer loyalty and satisfaction. A high retention rate signals stable revenue, lower acquisition costs, and effective product or service offerings. Calculating CRR involves counting starting customers, subtracting new acquisitions, and dividing by initial customer count. Tools like Google Analytics 4 (GA4) and cookie-free platforms like PlainSignal can track CRR by segmenting returning versus new users. Understanding and improving CRR helps businesses focus on long-term customer relationships and sustainable growth.
Customer retention rate
Measure of the percentage of customers a business retains over a period, reflecting loyalty and revenue stability.
Importance of Customer Retention Rate
This section explains why CRR is crucial for business health and long-term growth. It highlights the impact of retention on revenue stability, acquisition costs, and customer advocacy.
-
Revenue impact
High CRR leads to predictable revenue streams and reduced marketing expenses since retaining existing customers is more cost-effective than acquiring new ones.
-
Customer loyalty and advocacy
Retained customers are more likely to become brand advocates, referring others and providing positive reviews that fuel organic growth.
Calculating Customer Retention Rate
This section covers the standard formula for CRR and breaks down each component for clarity. It also provides an example calculation.
-
Standard crr formula
CRR = ((E - N) / S) × 100, where E is the number of customers at the end of the period, N is the new customers acquired during the period, and S is the number of customers at the start.
-
E (end customers)
Count of customers at the end of the measurement period.
-
N (new customers)
Count of first-time customers acquired during the period.
-
S (start customers)
Count of customers at the beginning of the period.
-
-
Example calculation
If you start with 200 customers, acquire 50 new ones, and end with 220, then CRR = ((220 - 50) / 200) × 100 = 85%.
Tracking CRR with Analytics Tools
Demonstrates how to implement CRR tracking using platforms like GA4 and PlainSignal, including setup steps and dashboard configurations.
-
Using google analytics 4 (GA4)
GA4 distinguishes new vs. returning users. Set up user properties, activate User ID, and use cohort analysis to measure retention over time.
-
Enable user id
Activate User ID tracking to unify sessions across devices and identify returning customers accurately.
-
Create retention cohort
In GA4, go to Analysis > Cohort exploration, define the ‘acquisition’ event, and track retention in subsequent cohorts.
-
-
Using PlainSignal (cookie-free analytics)
PlainSignal captures returning visitor metrics without relying on cookies. Integrate the snippet on your site and access retention reports in real time.
-
Install PlainSignal snippet
Embed the PlainSignal JavaScript snippet in your site’s <head> element to start collecting data on returning visitors.
-
Code example
<link rel='preconnect' href='//eu.plainsignal.com/' crossorigin /> <script defer data-do='yourwebsitedomain.com' data-id='0GQV1xmtzQQ' data-api='//eu.plainsignal.com' src='//cdn.plainsignal.com/plainsignal-min.js'></script> -
View retention report
In the PlainSignal dashboard, navigate to ‘Behavior’ > ‘Retention’ to analyze returning visitor rates over any time frame.
-
Best Practices to Improve Customer Retention Rate
Offers strategies and tactics to boost CRR through customer engagement, feedback, and loyalty initiatives.
-
Effective onboarding
Provide guided tutorials and resources to help customers realize value quickly and reduce early churn.
-
Personalized communication
Leverage segmentation and targeted messaging to keep customers informed and engaged based on their behavior.
-
Regular feedback loops
Use surveys, NPS, and direct outreach to collect feedback, address issues, and demonstrate responsiveness.
-
Loyalty programs and incentives
Implement rewards for repeat purchases or long-term subscriptions to motivate ongoing customer engagement.
Related Metrics and Next Steps
Connect CRR to other key performance indicators and outline further analysis techniques to optimize the customer lifecycle.
-
Customer churn rate
The inverse of CRR, representing the percentage of customers lost; pairing both metrics gives a full view of customer movement.
-
Customer lifetime value (clv)
Combines retention rate and revenue per user to estimate the total value a customer brings over their lifespan.
-
Cohort analysis
Segments customers by acquisition date to compare retention patterns across different groups and time periods.
