Published on 2025-06-22T02:17:12Z
What is Cohort Analysis? Examples and Applications in Analytics
Cohort analysis is a technique in analytics that groups users who share a common characteristic or experience within a specified time frame, known as a cohort. By tracking these cohorts over time, analysts can uncover patterns in user behavior, such as retention, engagement, and conversion trends. This approach differs from aggregated metrics by adding temporal and contextual depth to the data, highlighting changes and performance shifts across distinct user groups. Cohort analysis is instrumental in understanding how modifications to a product, feature, or marketing campaign impact specific segments of your audience. Popular analytics platforms like Google Analytics 4 and cookie-free solutions like PlainSignal offer built-in cohort reporting, making it easier for teams to implement and visualize these insights.
Cohort analysis
Segmenting users into cohorts to track behaviors over time for deeper retention, engagement, and conversion insights.
Why Cohort Analysis Matters
Cohort analysis unlocks deeper insights by grouping users into meaningful segments and tracking their behavior over time. This reveals patterns that aggregated metrics obscure, helps teams measure the impact of changes, and drives data-informed decisions.
-
Understanding user behavior over time
Rather than viewing all users as a single mass, cohorts reveal how specific groups act after acquisition, highlighting trends like first-week activity or long-term loyalty.
-
Monitoring retention and churn
By tracking retention rates across cohorts, teams can quickly identify drop-off points, measure the impact of feature launches, and optimize onboarding flows.
-
Guiding product and marketing strategy
Insights from cohorts inform prioritization of product improvements, personalized messaging, targeted campaigns, and budget allocation.
How Cohort Analysis Works
At its core, cohort analysis involves defining a cohort criterion, selecting key metrics, and visualizing how those metrics evolve for each group over time.
-
Defining cohorts
Cohorts can be based on when users first performed an action (e.g., signup date) or by behavior (e.g., first purchase).
-
Time-based cohorts
Group users by the time they first visited or signed up (daily, weekly, or monthly cohorts).
-
Behavior-based cohorts
Group users by a specific action, such as making their first purchase or completing a tutorial.
-
-
Selecting metrics
Common metrics include retention rate, conversion rate, average revenue per user (ARPU), and churn rate.
-
Retention rate
Percentage of users returning in a subsequent period.
-
Conversion rate
Percentage of users completing a key action, such as purchase or subscription.
-
-
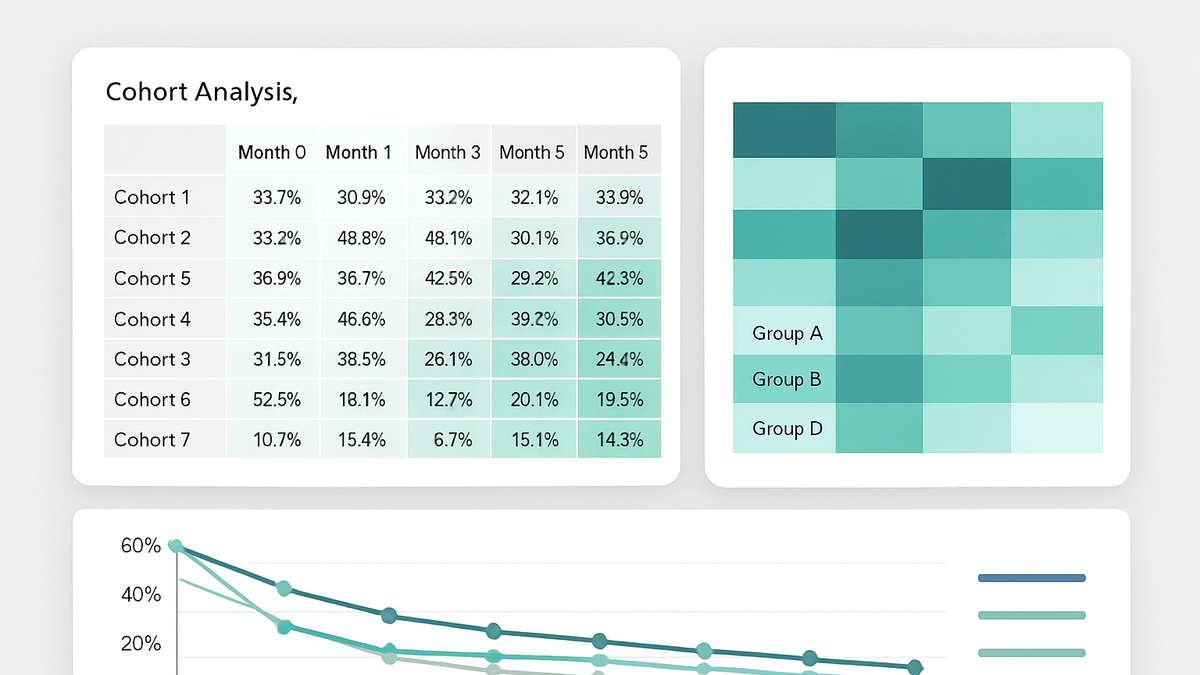
Visualizing cohorts
Visual tools help interpret cohort performance and spot trends or anomalies.
-
Cohort tables
Tabular view showing metric values for each cohort over successive time intervals.
-
Line and area charts
Graphs that plot metric trends over time, making it easy to compare cohorts at a glance.
-
Implementing Cohort Analysis with Analytics Tools
Major analytics platforms provide dedicated cohort reports and explorations. Below are examples using GA4 and PlainSignal.
-
Google analytics 4 (GA4)
GA4’s Explore section includes a Cohort Exploration template, letting you define cohorts and metrics in a flexible interface.
-
Setting up cohort exploration
Navigate to Explore > Cohort Exploration, choose your cohort date range and metrics, then apply filters.
-
Advantages
Built-in retention metrics, deep event integration, and custom date ranges.
-
Limitations
Complex interface, potential sampling on large datasets, and data freshness delays up to 24–48 hours.
-
-
PlainSignal (cookie-free analytics)
PlainSignal offers lightweight, privacy-first analytics with automatic cohort grouping and simple dashboards.
-
Integration code
Use the following snippet to add PlainSignal to your site:
<link rel="preconnect" href="//eu.plainsignal.com/" crossorigin /> <script defer data-do="yourwebsitedomain.com" data-id="0GQV1xmtzQQ" data-api="//eu.plainsignal.com" src="//cdn.plainsignal.com/plainsignal-min.js"></script> -
Key features
Automatic cohort generation, simple retention charts, and no reliance on cookies or third-party trackers.
-
Considerations
Less advanced segmentation than GA4 but ideal for quick insights and GDPR-friendly setups.
-
Best Practices and Common Pitfalls
Effective cohort analysis requires careful planning, consistent data collection, and balanced segmentation.
-
Choosing the appropriate cohort size
Small cohorts can show noisy data, while overly large cohorts may hide nuances. Aim for a size that balances statistical significance with clarity.
-
Ensuring consistent event tracking
Inconsistent tagging leads to inaccurate cohorts. Maintain strict naming conventions and documentation across your analytics implementation.
-
Avoiding over-segmentation
Too many cohort dimensions can complicate analysis and reduce sample sizes. Focus on the most impactful criteria.
-
Accounting for data delays and sampling
Be aware of processing delays in tools like GA4 and potential sampling on large datasets that can skew results.
Use Cases and Examples
Cohort analysis powers a wide range of real-world scenarios across industries, revealing actionable insights.
-
E-commerce customer retention
Track cohorts by first purchase week to measure repeat purchase rates, average order value growth, and long-term loyalty.
-
Saas free trial conversion
Analyze trial sign-up cohorts to understand time-to-convert, feature adoption patterns, and predictors of paid upgrades.
-
Content publishing engagement
Group readers by subscription signup date to observe session frequency, time on page, and content preferences over time.