Published on 2025-06-28T02:50:42Z
What are User Cohorts? Examples of Cohort Analysis in Analytics
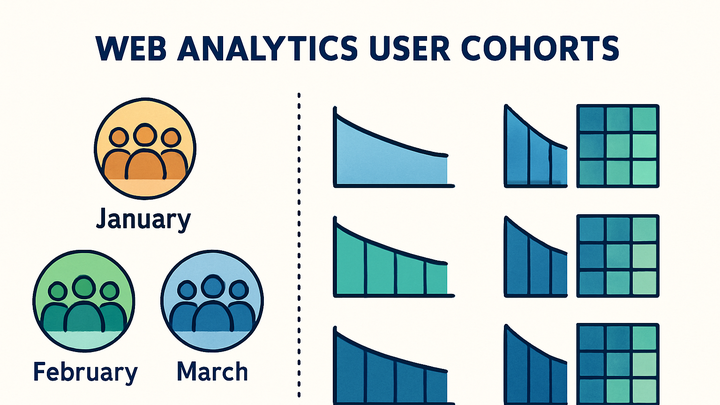
User cohorts in analytics refer to groups of users who share a common characteristic, such as the date of first visit, acquisition channel, or specific behavior. By segmenting users into cohorts, analysts can track and compare user retention, engagement, and lifetime value across different user groups over time. Cohort analysis provides deeper insights into how product changes, marketing campaigns, or external factors impact user behavior and helps identify trends that aggregate metrics might obscure. Tools like PlainSignal and Google Analytics 4 support cohort analysis, each offering interfaces to define cohorts and visualize retention tables. Effective cohort analysis can guide product development, optimize user onboarding, and improve long-term growth strategies.
User cohorts
Cohorts group users by shared traits to analyze retention and behavior over time in analytics tools.
Understanding User Cohorts
This section defines what user cohorts are and the main types commonly used in analytics.
-
Definition
A user cohort is a group of users who share a common attribute or experience, such as the date they first used a product or performed a specific action.
-
Types of cohorts
There are several ways to categorize cohorts based on attributes or behavior.
-
Acquisition cohorts
Grouped by the time or channel through which users were acquired (e.g., week of signup).
-
Behavioral cohorts
Grouped by actions users take within the product (e.g., users who completed onboarding).
-
Time-based cohorts
Grouped by calendar intervals such as daily, weekly, or monthly periods.
-
Why Cohort Analysis Matters
Cohort analysis helps you measure changes in user behavior over time and compare different groups to understand retention, engagement, and revenue patterns.
-
Measure retention and churn
Track how many users from each cohort return over subsequent periods to identify retention rates and churn points.
-
Optimize onboarding and engagement
Identify where users drop off and refine onboarding flows or features to improve long-term engagement.
-
Inform product and marketing strategies
Compare cohorts exposed to different campaigns or features to see which drives higher lifetime value.
Implementing Cohort Tracking
Learn how to set up cohort tracking in PlainSignal and Google Analytics 4, including installation steps and code examples.
-
PlainSignal (cookie-free analytics)
PlainSignal captures events and automatically groups users into cohorts based on attributes like first visit date.
-
Installation
Add the PlainSignal script snippet to your website’s
<head>to start collecting data. -
Example code
<link rel="preconnect" href="//eu.plainsignal.com/" crossorigin />
<script defer data-do="yourwebsitedomain.com" data-id="0GQV1xmtzQQ" data-api="//eu.plainsignal.com" src="//cdn.plainsignal.com/plainsignal-min.js"></script>
-
-
Google analytics 4 (GA4)
GA4 automatically records key lifecycle events like
first_visitthat can be used for cohort reports.-
Setup
Install the GA4 global site tag to enable data collection.
-
Example code
<!-- Google tag (gtag.js) --> <script async src="https://www.googletagmanager.com/gtag/js?id=G-XXXXXXXXXX"></script> <script> window.dataLayer = window.dataLayer || []; function gtag(){dataLayer.push(arguments);} gtag('js', new Date()); gtag('config', 'G-XXXXXXXXXX'); </script> -
Accessing cohort reports
In GA4, go to Analysis → Cohort to view retention tables and compare cohorts.
-
Analyzing Cohort Data
This section covers key metrics and how to interpret cohort tables and charts.
-
Retention rate
The percentage of users in a cohort who return in each subsequent period.
-
Cohort size
The number of users in the cohort at the start period. Larger cohorts yield more reliable data.
-
Drop-off patterns
Identify when and why users disengage by examining significant declines in retention.
Best Practices and Common Pitfalls
Tips to ensure accurate cohort analysis and avoid mistakes that can lead to misleading insights.
-
Define cohorts strategically
Choose cohort criteria aligned with your business goals to ensure actionable insights.
-
Use consistent time intervals
Apply uniform periods (daily, weekly, monthly) to compare cohorts effectively.
-
Watch for data sampling
Be aware that tools like GA4 may sample large datasets, which can distort small cohort analysis.
-
Ensure sufficient cohort size
Avoid very small cohorts, as they can produce unreliable statistical results.
