Published on 2025-06-27T19:34:51Z
What is Cohort exploration? Examples in GA4 & PlainSignal
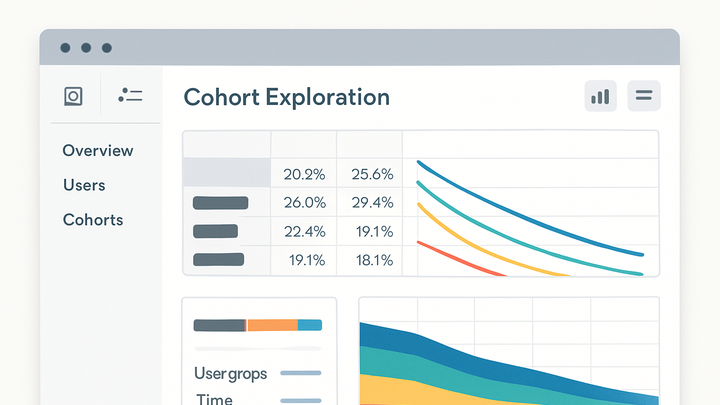
Cohort exploration is a technique in analytics that groups users who share common characteristics within a defined time frame (a cohort) to analyze their behavior and retention over time. This method helps businesses understand how different user segments engage with their product, revealing patterns like churn, retention, and feature adoption. In Google Analytics 4 (GA4), cohort exploration provides a flexible interface to configure and visualize cohorts based on acquisition date, events, or user properties. PlainSignal, a cookie-free simple analytics platform, offers lightweight cohort reporting with minimal configuration. Below is an example snippet to add PlainSignal tracking to your website:
<link rel="preconnect" href="//eu.plainsignal.com/" crossorigin />
<script defer data-do="yourwebsitedomain.com" data-id="0GQV1xmtzQQ" data-api="//eu.plainsignal.com" src="//cdn.plainsignal.com/plainsignal-min.js"></script>
By leveraging these tools, you can uncover critical insights into user lifecycle metrics and optimize your strategies accordingly.
Cohort exploration
Cohort exploration segments users by shared traits to analyze behavior and retention over time, using tools like GA4 and PlainSignal.
Understanding Cohort exploration
This section defines cohort exploration and explains its value in analytics.
-
Definition of a cohort
A cohort is a group of users who share a common characteristic during a specific time period, such as sign-up date or first purchase. Cohort exploration examines these groups to track metrics like retention.
-
Benefits of cohort exploration
By analyzing cohorts, you can identify patterns in user behavior, measure retention, and evaluate the impact of product changes or marketing campaigns.
Performing Cohort exploration in GA4
Step-by-step guide to setting up and analyzing cohorts within Google Analytics 4 interface.
-
Accessing the cohort exploration report
In GA4, navigate to Analysis > Explore. Select ‘Cohort exploration’ as the technique to begin.
-
Configuring your cohort
Define the cohort by choosing the cohort type (e.g., Acquisition date), date range, granularity (daily, weekly), and the user metric (e.g., Active users, Retention rate).
-
Cohort type
Select whether cohorts are based on event date, first open, or acquisition.
-
Date range & granularity
Choose the period and interval to group users (e.g., daily or weekly cohorts).
-
Metric selection
Pick metrics like user retention, revenue, or engagement for analysis.
-
-
Interpreting the results
Analyze the cohort table to identify retention curves and changes in user behavior across cohorts.
-
Retention curve
Look for the percentage of users who return over time.
-
Drop-off points
Identify where significant user loss occurs and investigate reasons.
-
Implementing Cohort exploration with PlainSignal
Learn how to configure and view cohort reports using PlainSignal’s lightweight, cookie-free analytics.
-
Adding PlainSignal tracking code
Insert the PlainSignal snippet into your site’s head to start collecting cohort data.
-
Script placement
Place the
<script>tags just before the closing</head>tag for optimal loading. -
Data attributes
Ensure
data-doanddata-idattributes match your domain and project ID.
-
-
Accessing cohort reports
Within PlainSignal dashboard, navigate to ‘Cohorts’ under the analytics menu to view cohort metrics.
-
Customizing cohort parameters
Set date ranges, user properties, and event filters to refine your cohort analysis in PlainSignal.
-
Date range filter
Select start and end dates to define the cohort period.
-
Event filters
Filter cohorts by specific user actions or segments.
-
Use Cases and Best Practices
Practical scenarios where cohort exploration is valuable, along with tips to maximize insights.
-
Retention analysis
Use cohorts to measure how long new users stay active over days or weeks, informing retention strategies.
-
Feature adoption tracking
Create cohorts based on users who access a new feature to monitor adoption rates and engagement.
-
Campaign performance evaluation
Analyze cohorts of users acquired via specific campaigns to compare long-term value and ROI.
