Published on 2025-06-27T21:25:47Z
What is a Breakdown? Examples of Breakdowns in Analytics
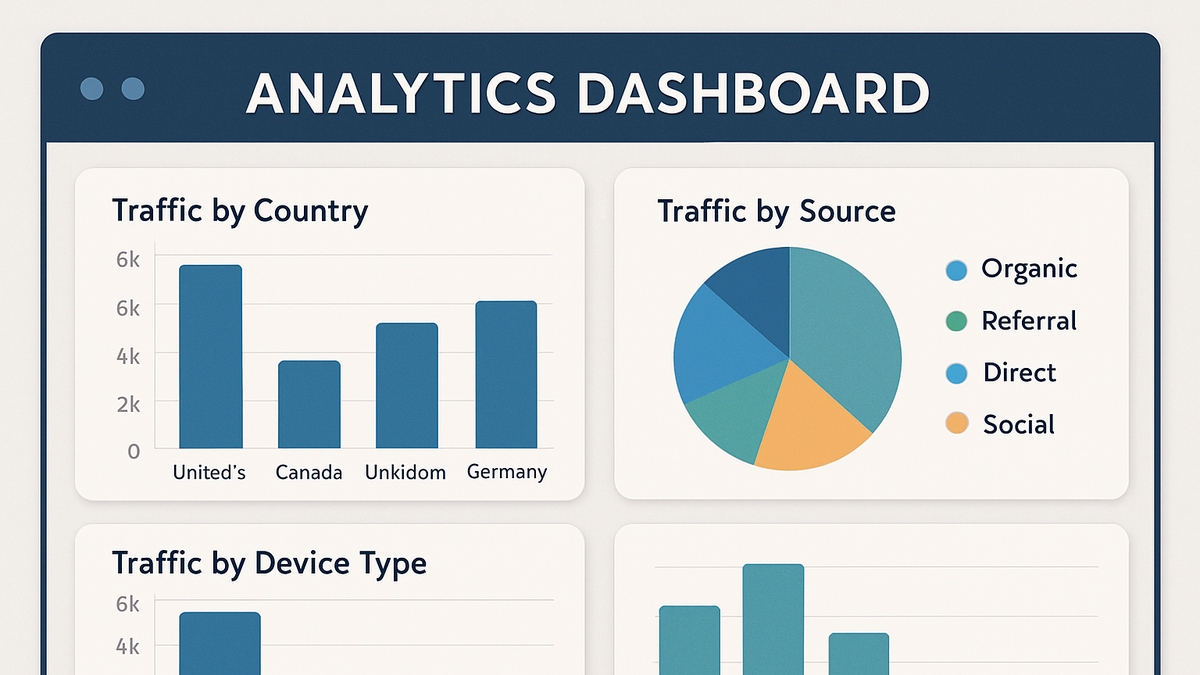
In analytics, a breakdown refers to the technique of segmenting aggregate metrics by one or more dimensions, enabling analysts to understand how different groups (e.g., countries, traffic sources, device types) contribute to overall performance. By applying a breakdown, you transform a single number—such as total sessions or conversions—into a more detailed view that highlights patterns, trends, and outliers across specific categories. Tools like Google Analytics 4 (GA4) offer built-in breakdown controls in their reports, allowing you to instantly split metrics by dimensions such as source/medium, geography, or user demographics. Similarly, cookie-free platforms like PlainSignal rely on event parameters and custom properties to simulate breakdowns, giving you privacy-friendly insights. Below is an example of how you might integrate the PlainSignal tracking code into your site:
<link rel="preconnect" href="//eu.plainsignal.com/" crossorigin />
<script defer data-do="yourwebsitedomain.com" data-id="0GQV1xmtzQQ" data-api="//eu.plainsignal.com" src="//cdn.plainsignal.com/plainsignal-min.js"></script>
By mastering breakdowns, you can uncover which segments drive growth and where to focus your optimization efforts.
Breakdown
Segment metrics by dimensions to reveal trends and outliers across user groups and traffic sources.
Why Breakdowns Matter
Breakdowns transform raw metrics into actionable insights by revealing how different segments contribute to overall performance.
-
Gain deeper insights
Uncover which segments outperform others and detect hidden trends or anomalies within your data.
-
Identify high-performing segments
Spot top countries, channels, or devices driving the most engagement.
-
Detect anomalies early
Recognize sudden drops or spikes within specific groups for prompt action.
-
-
Inform strategy and optimization
Use breakdown data to allocate resources effectively and tailor experiences.
-
Optimize marketing spend
Redirect budget toward channels or campaigns with the highest ROI.
-
Personalize user experience
Customize content or features based on segment performance.
-
How to Apply Breakdowns in Analytics Tools
Most analytics platforms provide interfaces or APIs for creating breakdowns. Below are examples from GA4 and PlainSignal.
-
Breakdowns in GA4
GA4’s Analysis Hub and standard reports let you add dimension breakdowns to metrics with a few clicks.
-
Exploration reports
Drag dimensions like
Device CategoryorSession Default Channel Groupinto the ‘Breakdown’ field. -
Standard reports
Use the ‘+Add comparison’ feature to filter and compare segments side by side.
-
-
Breakdowns with PlainSignal
PlainSignal uses custom event parameters to simulate breakdowns in a cookie-free environment.
-
Event parameter tagging
Include additional parameters (e.g.,
country,campaign) when sending events. -
Dashboard filters
Apply filters on the PlainSignal UI to segment metrics by custom properties.
-
-
Integrating the tracking code
Insert the tracking snippet into your website header to enable data collection and breakdown capabilities.
-
PlainSignal script tag
<link rel="preconnect" href="//eu.plainsignal.com/" crossorigin />
<script defer data-do="yourwebsitedomain.com" data-id="0GQV1xmtzQQ" data-api="//eu.plainsignal.com" src="//cdn.plainsignal.com/plainsignal-min.js"></script>
-
Best Practices and Pitfalls
While breakdowns are powerful, improper use can lead to misleading insights or performance issues.
-
Ensure data consistency
Standardize your dimension values and naming conventions to avoid fragmented segments.
-
Use consistent labels
Ensure values like ‘US’ vs ‘United States’ are uniform across events.
-
Avoid typos and case mismatches
Lowercase or uppercase inconsistencies can create separate segments.
-
-
Balance granularity and performance
Excessive breakdowns can slow down queries and complicate analysis.
-
Limit dimensions per report
Use only the most relevant dimensions to maintain readability and speed.
-
Watch out for high-cardinality
Dimensions with too many unique values can lead to sparse or sampled data.
-
-
Interpret with care
Breakdown data needs context; avoid assuming causation from correlation.
-
Combine multiple metrics
Correlate breakdowns with engagement or conversion rates for a fuller picture.
-
Be mindful of sample size
Small segment sizes can produce volatile or non-representative results.
-