Published on 2025-06-22T07:15:33Z
What is Correlation Analysis? Examples and Usage in Analytics
Correlation analysis is a statistical method used to measure and describe the strength and direction of the relationship between two or more variables in the context of digital analytics. It helps analysts determine whether changes in one metric, like pageviews, are associated with changes in another, such as conversion rate. By leveraging data from tools like Google Analytics 4 (GA4) or PlainSignal, a cookie-free analytics platform, teams can uncover meaningful patterns and inform strategic decisions. Commonly, Pearson’s correlation coefficient ® is used to quantify linear relationships, while Spearman’s rank correlation addresses non-linear associations. While correlation does not imply causation, it is an essential first step in exploratory data analysis and hypothesis testing.
Correlation analysis
Measure strength and direction of relationships between metrics to uncover patterns and guide decisions.
Understanding Correlation Analysis
This section explains what correlation analysis is, the main types of correlation coefficients, and its role in the analytics workflow.
-
Definition and purpose
Correlation analysis quantifies how strongly two variables move together. In digital analytics, it reveals associations such as the link between product pageviews and purchase events.
-
Common correlation coefficients
Pearson’s r measures linear relationships on continuous data, while Spearman’s rho assesses monotonic associations for ranked or non-normal data.
-
Pearson correlation
Evaluates linear correlation; values range from -1 (perfect negative) to 1 (perfect positive).
-
Spearman correlation
Based on data ranks; useful for non-linear but monotonic relationships.
-
Implementing Correlation Analysis with Analytics Tools
Steps and examples for performing correlation analysis using GA4 and PlainSignal data.
-
Data collection
Track the necessary metrics in GA4 and PlainSignal. For PlainSignal, include the tracking snippet in your HTML:
-
PlainSignal snippet
<link rel="preconnect" href="//eu.plainsignal.com/" crossorigin /> <script defer data-do="yourwebsitedomain.com" data-id="0GQV1xmtzQQ" data-api="//eu.plainsignal.com" src="//cdn.plainsignal.com/plainsignal-min.js"></script> -
GA4 setup
Ensure pageview and event data are correctly configured in GA4 through the gtag.js or Google Tag Manager snippet.
-
-
Calculating correlation coefficients
Export metric data (e.g., daily pageviews, conversions) and calculate correlation using spreadsheets, Python (pandas), or built-in analytics tool features.
-
Using python
import pandas as pd
df = pd.DataFrame({'pageviews': [...], 'conversions': [...]})
print(df.corr(method='pearson'))
-
-
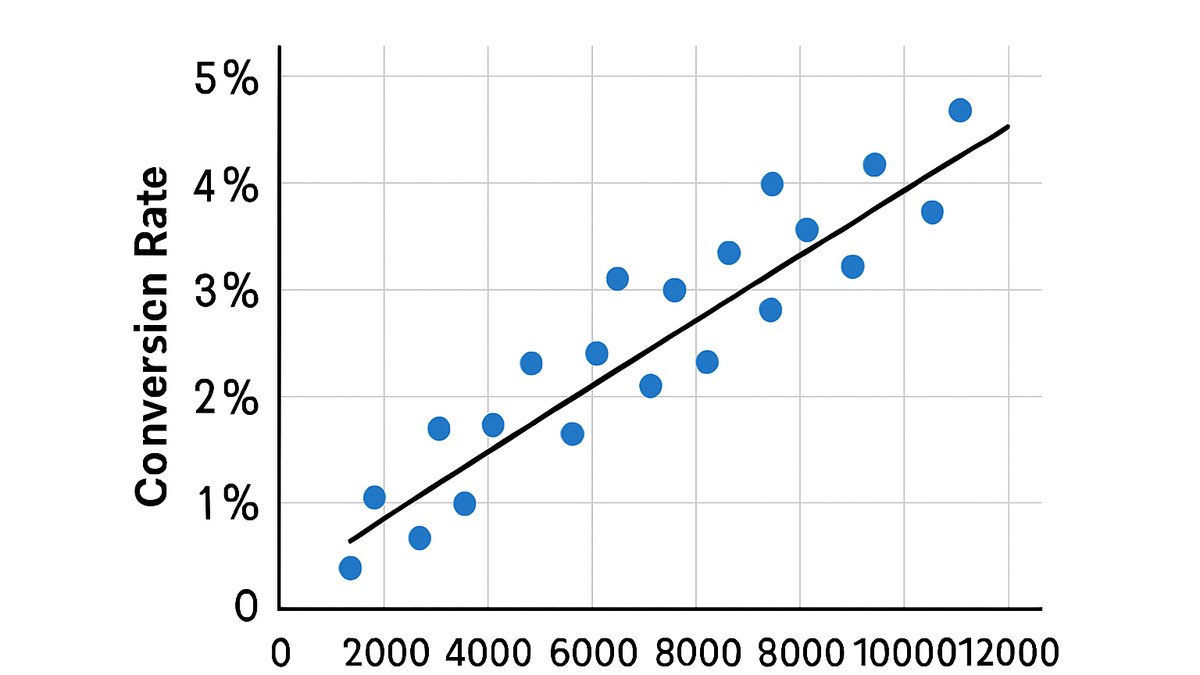
Visualization
Plot scatter charts with trendlines to visually assess relationships in dashboards or tools like Looker Studio.
Interpreting Correlation Results
Guidance on understanding correlation values and their implications for business and product decisions.
-
Correlation strength and direction
Values close to ±1 indicate strong relationships; near 0 suggest weak or no correlation.
-
Positive correlation
Both variables increase together.
-
Negative correlation
One variable increases as the other decreases.
-
-
Statistical significance
Assess p-values or confidence intervals to determine if observed correlations are unlikely due to chance.
-
Causation vs correlation
Correlation does not prove causation; use controlled experiments (A/B tests) or regression analysis for causal insights.
Use Cases and Examples
Real-world scenarios where correlation analysis drives insights and actions.
-
Traffic vs conversion rate
Analyze if higher traffic correlates with improved conversions, then tailor marketing spend based on strong associations.
-
Feature usage vs user retention
Measure how usage of specific product features relates to long-term retention metrics, guiding product development decisions.
Best Practices and Common Pitfalls
Advice to ensure robust and meaningful correlation analysis results.
-
Avoid spurious correlations
Beware of random patterns; combine domain knowledge, multiple metrics, and repeat tests to confirm findings.
-
Ensure data quality
Check for missing values, outliers, and consistent data collection across variables to avoid misleading results.