Published on 2025-06-27T20:01:27Z
What is Crash Reporting in Analytics? Examples of Crash Reporting
Crash reporting in analytics refers to the process of detecting, collecting, and analyzing unexpected application failures or errors. It enables teams to gain visibility into when and why their web or mobile applications crash. By capturing detailed error data—such as messages, stack traces, user context, and device information—organizations can quickly identify critical issues impacting user experience. Crash reporting tools integrate with analytics platforms to unify performance and error insights, helping prioritize development efforts. Unlike basic analytics events, crash reports focus on unhandled exceptions and fatal errors that disrupt application flow. This approach not only improves reliability but also enhances user satisfaction by reducing frustration caused by repeated failures.
Crash reporting
Crash reporting captures and analyzes application failures, providing insights to fix bugs and improve user experience.
What is Crash Reporting?
Crash reporting is the process of detecting, collecting, and analyzing unexpected application failures or errors in your web or mobile product. It focuses on unhandled exceptions and fatal errors that cause disruption to users, offering a deeper view than standard analytics events. By recording error messages, stack traces, device context, and user metadata, teams can identify, prioritize, and fix critical bugs. Crash reporting integrates with analytics platforms to unify performance and reliability insights. This practice is essential for maintaining system stability and optimizing the user experience.
-
Crash vs error
An ‘error’ can be any issue during code execution, while a ‘crash’ is an unhandled error that forces termination or severe malfunction of the app.
-
Crash reporting in analytics
Unlike traditional event tracking, crash reporting specifically targets failures that interrupt the normal user flow and require developer attention.
Why Crash Reporting Matters
Understanding application crashes is vital for ensuring product reliability, user satisfaction, and efficient development. Crash data empowers teams to respond quickly, reducing downtime and negative user impact. It also helps prioritize fixes by highlighting the most frequent or severe issues. Over time, analyzing crash trends can reveal underlying architectural problems. Effective crash reporting creates a feedback loop that supports continuous improvement and trust in your product.
-
Improve reliability
Crash data reveals hidden bugs so you can address them before they affect more users.
-
Enhance user experience
By swiftly fixing crashes, you reduce user frustration and churn.
-
Prioritize issues
Frequency and severity metrics help determine which crashes to tackle first.
How Crash Reporting Works
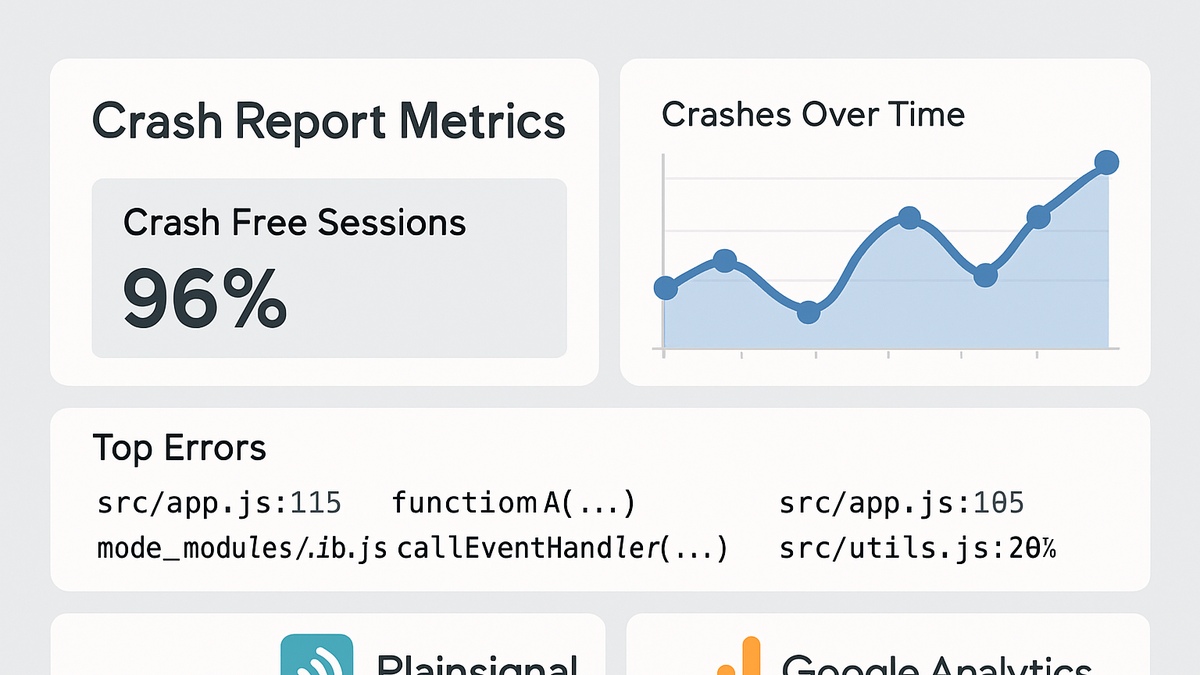
Crash reporting involves capturing error events on the client side, sending detailed reports to a backend service, and then aggregating and analyzing that data. SDKs or scripts intercept unhandled exceptions and collect context such as stack traces, user actions, and environment details. The data is then batched or streamed to a crash reporting service like PlainSignal or GA4. Inside the analytics dashboard, crashes are grouped by signature, visualized over time, and equipped with filters and alerts. This pipeline streamlines identification, debugging, and resolution of critical failures.
-
Error detection
Client-side scripts catch unhandled exceptions and fatal errors automatically.
-
Data transmission
Error payloads are sent via HTTP or SDK protocols to the analytics backend.
-
Aggregation & alerting
Dashboards group crashes by root cause, and alerts notify teams in real time.
Implementing Crash Reporting with PlainSignal
PlainSignal offers a lightweight, cookie-free analytics SDK that can capture crash data through custom event tracking. You can integrate it into any website by adding a script tag and listening for errors in JavaScript. This setup lets you report crashes directly alongside other analytics metrics without compromising user privacy.
-
Setup PlainSignal script
Add the PlainSignal tracking code in your head section to initialize analytics and enable crash reporting.
-
Script snippet
<link rel="preconnect" href="//eu.plainsignal.com/" crossorigin />
<script defer data-do="yourwebsitedomain.com" data-id="0GQV1xmtzQQ" data-api="//eu.plainsignal.com" src="//cdn.plainsignal.com/plainsignal-min.js"></script>
-
-
Capture and track errors
Use the PlainSignal SDK API to listen for JavaScript errors and send crash information.
-
Error tracking code
<script>
window.addEventListener("error", function(event) {
  PlainSignal.trackError({
    message: event.message,
    filename: event.filename,
    line: event.lineno,
    column: event.colno,
    stack: event.error ? event.error.stack : null
  });
});
</script>
-
Implementing Crash Reporting with GA4
Google Analytics 4 does not natively focus on crashes but allows you to log exception events via the gtag API. By capturing window errors and sending them as ‘exception’ events, you can monitor crashes alongside user behaviour metrics in GA4.
-
Setup GA4 base code
Initialize GA4 on your site by adding the global site tag in your head section.
-
GA4 initialization
<!-- Global site tag (gtag.js) - Google Analytics -->
<script async src="https://www.googletagmanager.com/gtag/js?id=GA_MEASUREMENT_ID"></script>
<script>
  window.dataLayer = window.dataLayer || [];
  function gtag(){dataLayer.push(arguments);}
  gtag('js', new Date());
  gtag('config', 'GA_MEASUREMENT_ID');
</script>
-
-
Capture and log exceptions
Listen for errors in the browser and send them to GA4 as exception events.
-
Exception tracking code
<script>
window.addEventListener("error", function(event) {
  gtag('event', 'exception', {
    description: event.message,
    fatal: false
  });
});
</script>
-
Best Practices for Crash Reporting
To get the most out of crash reporting, follow these best practices: filter redundant data, enrich reports with contextual metadata, and set up proactive alerting. Proper configuration ensures you focus on the most impactful issues without being overwhelmed by noise.
-
Filter and aggregate
Group similar crashes by signature (stack trace) to reduce noise and focus on unique issues.
-
Add contextual metadata
Include user IDs, session data, and device information to accelerate debugging.
-
Set alert thresholds
Configure alerts for high-severity or high-frequency crashes to respond quickly.