Published on 2025-06-26T05:34:22Z
What is Customer Effort Score (CES)? Examples & Implementation
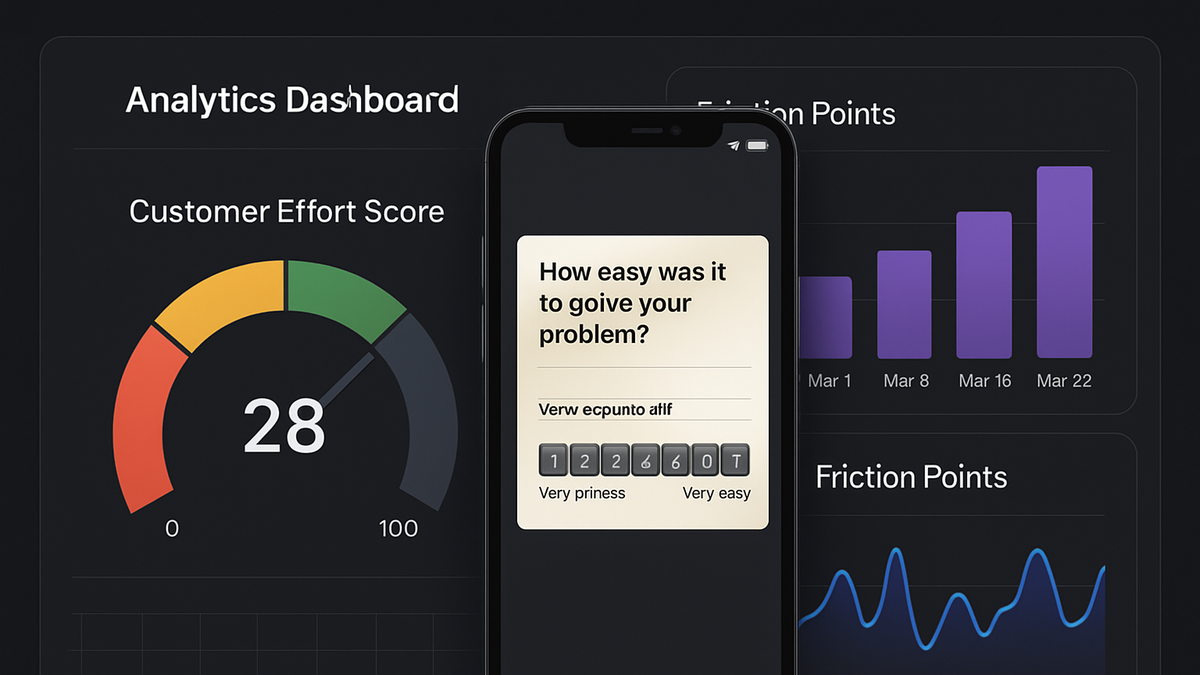
Customer Effort Score (CES) is a key customer experience metric used in analytics to measure the ease or difficulty of a customer’s interaction with a product, service, or company. It typically relies on a single-question survey asking customers to rate their perceived effort on a numerical scale. CES was introduced by CEB (now Gartner) as a predictor of customer loyalty and satisfaction. Tracking CES helps teams identify friction points in user journeys, optimize processes, and reduce churn by lowering customer effort. With integration into analytics platforms like Google Analytics 4 or lightweight solutions like PlainSignal, businesses can collect, analyze, and act on CES data in real-time. In the sections below, we’ll explore how to design surveys, implement tracking code, calculate CES, and translate insights into actionable improvements.
Customer effort score (ces)
CES measures how much effort customers exert interacting with your product, helping teams reduce friction and improve experience.
Understanding Customer Effort Score
This section covers the core concept of Customer Effort Score, its definition, and its original purpose within customer experience management.
-
Definition of ces
Customer Effort Score (CES) quantifies the amount of effort a customer must expend to accomplish a specific task, such as resolving an issue or completing a purchase.
-
Origins and purpose
Introduced by CEB (now Gartner), CES is designed to predict customer loyalty and identify friction in the customer journey. It emphasizes reducing effort to boost retention.
Importance of CES in Analytics
Explore why CES is a critical metric for businesses, how it influences customer loyalty, and its relationship with other key metrics.
-
Reducing customer friction
High CES indicates points of friction where customers struggle, allowing teams to streamline processes and improve user flows.
-
Impact on loyalty and retention
Lower effort correlates with higher satisfaction, increasing the likelihood of repeat business and positive word-of-mouth.
Implementing CES Surveys
Learn how to design an effective CES survey and integrate it into your analytics stack using PlainSignal or Google Analytics 4.
-
Survey design best practices
Craft a clear, concise question and choose an appropriate scale to ensure reliable responses.
-
Question format
Use a single-question survey like ‘How much effort did you personally have to exert to handle your request?’
-
Scale selection
Common scales include 1–5 or 1–7, where lower values indicate less effort and higher values indicate more effort.
-
-
Using PlainSignal
PlainSignal provides a cookie-free, lightweight way to embed CES surveys and view results in a simple dashboard.
-
Tracking code
<link rel="preconnect" href="//eu.plainsignal.com/" crossorigin />
<script defer data-do="yourwebsitedomain.com" data-id="0GQV1xmtzQQ" data-api="//eu.plainsignal.com" src="//cdn.plainsignal.com/plainsignal-min.js"></script>
-
-
Using google analytics 4
Leverage GA4’s custom events to collect CES responses alongside other user interactions.
-
GA4 event setup
Create a custom event named
ces_responsewith a parameterces_scoreto capture the response value. -
Example code
gtag('event', 'ces_response', { 'ces_score': score, 'survey_id': 'ces_s1' });
-
Analyzing and Acting on CES Data
Discover how to calculate CES, interpret results, and derive actionable insights for reducing customer effort.
-
Calculating ces
Compute CES as an average score or a percentage of low-effort responses to understand overall ease of use.
-
Average score method
Sum all CES scores and divide by the number of responses to get the mean effort level.
-
Low-effort percentage
Calculate the percentage of responses that fall within the ‘low effort’ range (e.g., 1–2 on a 1–5 scale).
-
-
Interpreting results
Benchmark CES against industry standards and identify specific touchpoints that drive high effort.
-
Benchmark values
Aim for average CES scores below 3 on a 1–5 scale; higher scores signal friction issues.
-
Identifying pain points
Correlate high-effort responses with customer journey data to pinpoint problematic steps.
-
Best Practices and Common Pitfalls
Guidelines for maximizing CES effectiveness and avoiding errors that can skew your insights.
-
Best practices
Follow these proven strategies to ensure your CES program yields accurate, actionable data.
-
Optimal timing
Trigger CES surveys immediately after task completion or support interactions for contextually relevant feedback.
-
Clear wording
Keep the phrasing simple and focused on effort rather than satisfaction or emotion.
-
Adequate sample size
Collect enough responses to achieve statistical significance without causing survey fatigue.
-
-
Common pitfalls
Watch out for these mistakes that can undermine the reliability of your CES metric.
-
Survey bias
Avoid leading questions and ensure a representative sample to reduce bias.
-
Low response rate
Use unobtrusive prompts and reminders to improve participation without annoying users.
-
Overemphasis on score alone
Combine CES with qualitative feedback and other metrics like CSAT and NPS for a holistic view.
-