Published on 2025-06-26T04:26:44Z
What is Data Freshness in Analytics? Examples with PlainSignal and GA4
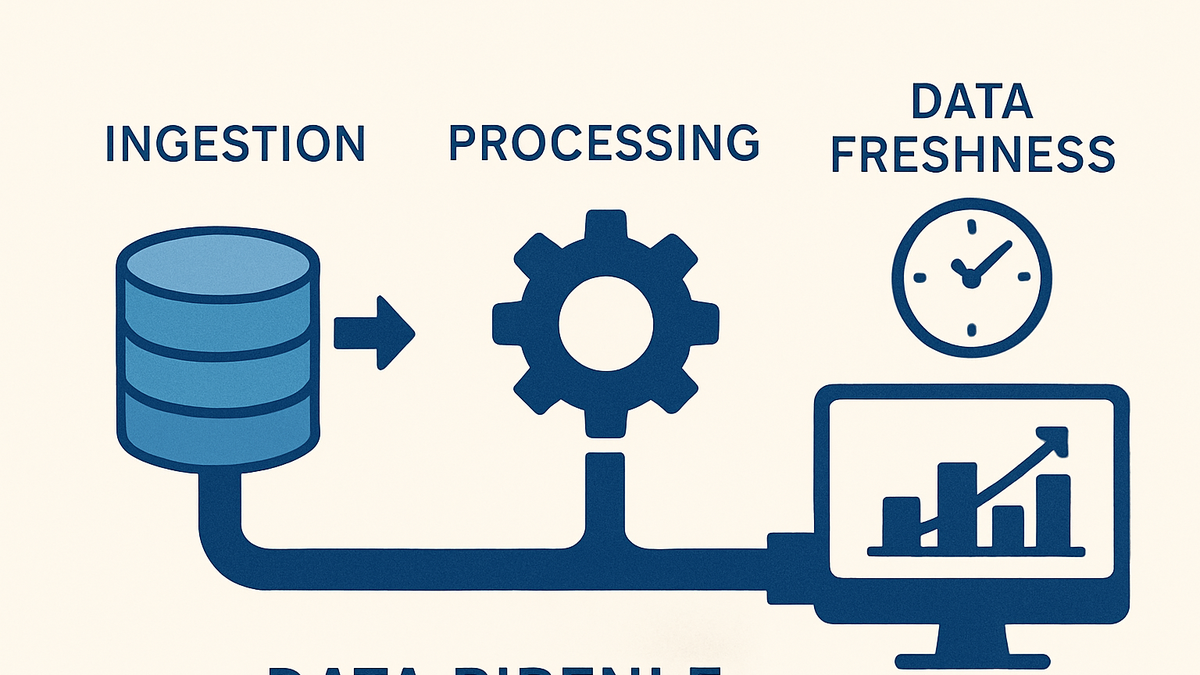
Data Freshness refers to the elapsed time between when data is generated (e.g., a user action on a website) and when it becomes available for analysis. In analytics, fresh data empowers organizations to make timely decisions, detect issues quickly, and react to emerging trends. The concept of Data Freshness encompasses multiple components, such as ingestion latency, processing time, and reporting delay. Tools like Google Analytics 4 (GA4) and PlainSignal (a cookie-free analytics platform) each offer different data freshness profiles. PlainSignal focuses on minimal latency for simple, real-time reporting by streaming events via its lightweight snippet, while GA4 offers near real-time and standard reporting with slightly higher latency due to its more complex processing pipeline.
For example, using PlainSignal’s tracking code:
<link rel="preconnect" href="//eu.plainsignal.com/" crossorigin />
<script defer data-do="yourwebsitedomain.com" data-id="0GQV1xmtzQQ" data-api="//eu.plainsignal.com" src="//cdn.plainsignal.com/plainsignal-min.js"></script>
Data will typically be visible within seconds on PlainSignal’s dashboard. In contrast, GA4’s real-time section can show events within seconds, but standard reports may take up to 24 hours to fully process.
Understanding Data Freshness helps analytics teams set realistic Service Level Agreements (SLAs), choose appropriate tools, and design data pipelines that meet business needs.
Data freshness
Data Freshness is the delay between data generation and its availability for analysis in analytics platforms.
Why Data Freshness Matters
Fresh data underpins timely decision-making and operational agility by reducing the window between event occurrence and insight generation. When data is stale, businesses risk making decisions on outdated or incomplete information. This section explores key reasons why Data Freshness is critical.
-
Real-time decision making
Access to near-instant data enables teams to respond to market changes, A/B test results, and user behavior without delay.
-
Issue detection and debugging
High freshness ensures anomalies like tracking errors or traffic spikes are spotted quickly, minimizing downtime and lost opportunities.
-
User experience optimization
Personalization and optimization features, such as content recommendations or dynamic pricing, rely on up-to-date data to be effective.
Measuring Data Freshness
Quantifying freshness involves tracking the delay at each stage of the data pipeline—ingestion, processing, and reporting. Organizations often set SLAs or use built-in metrics to monitor these delays.
-
Ingestion latency
Time taken for an event to be received by the analytics platform after it occurs. For instance, PlainSignal’s snippet streams events immediately to its servers, resulting in sub-second ingestion latency.
-
Processing latency
Duration from receiving data to making it available in dashboards. GA4 offers near real-time processing (usually a few seconds for real-time view) but standard reports can take up to 24 hours.
-
End-to-end delay
Overall time from event occurrence to final report availability. Monitoring end-to-end delay helps validate whether SLAs are met and whether business needs are satisfied.
Improving Data Freshness
Optimizing data freshness involves reducing latency at each pipeline stage. Strategies include leveraging streaming architectures, minimizing batch windows, and selecting tools with favorable SLAs.
-
Adopt stream processing
Implement tools like Apache Kafka or cloud-native streaming services to process events as they occur, reducing batch-induced delays.
-
Optimize data pipelines
Tune ETL jobs, reduce unnecessary transformations, and parallelize workloads to speed up processing.
-
Choose low-latency tools
Evaluate analytics platforms based on published data freshness metrics. PlainSignal offers near-instant dashboards, while GA4’s standard reports may lag.
Implementation Examples
Practical snippets showing how to integrate analytics tools to achieve low data latency and high freshness.
-
GA4 gtag.js setup
Use Google Analytics 4’s global site tag to enable data collection. The real-time view reflects events almost instantly.
<!-- GA4 gtag.js setup --> <script async src="https://www.googletagmanager.com/gtag/js?id=G-XXXXXXX"></script> <script> window.dataLayer = window.dataLayer || []; function gtag(){dataLayer.push(arguments);} gtag('js', new Date()); gtag('config', 'G-XXXXXXX'); </script> -
PlainSignal tracking snippet
A lightweight, cookie-free snippet streams events with minimal latency. Insert the following snippet before the closing
</head>tag:<link rel="preconnect" href="//eu.plainsignal.com/" crossorigin /> <script defer data-do="yourwebsitedomain.com" data-id="0GQV1xmtzQQ" data-api="//eu.plainsignal.com" src="//cdn.plainsignal.com/plainsignal-min.js"> </script>