Published on 2025-06-26T04:11:49Z
What is DebugView? Real-Time Analytics Debugging with GA4 & PlainSignal
DebugView is a real-time event monitoring interface used in analytics platforms to validate and
troubleshoot event collection. It captures and displays analytics events as they are received by the
system, allowing developers and analysts to verify correct implementation. This feature is invaluable for
QA, helping to identify missing parameters, incorrect event names, or unexpected data patterns before data
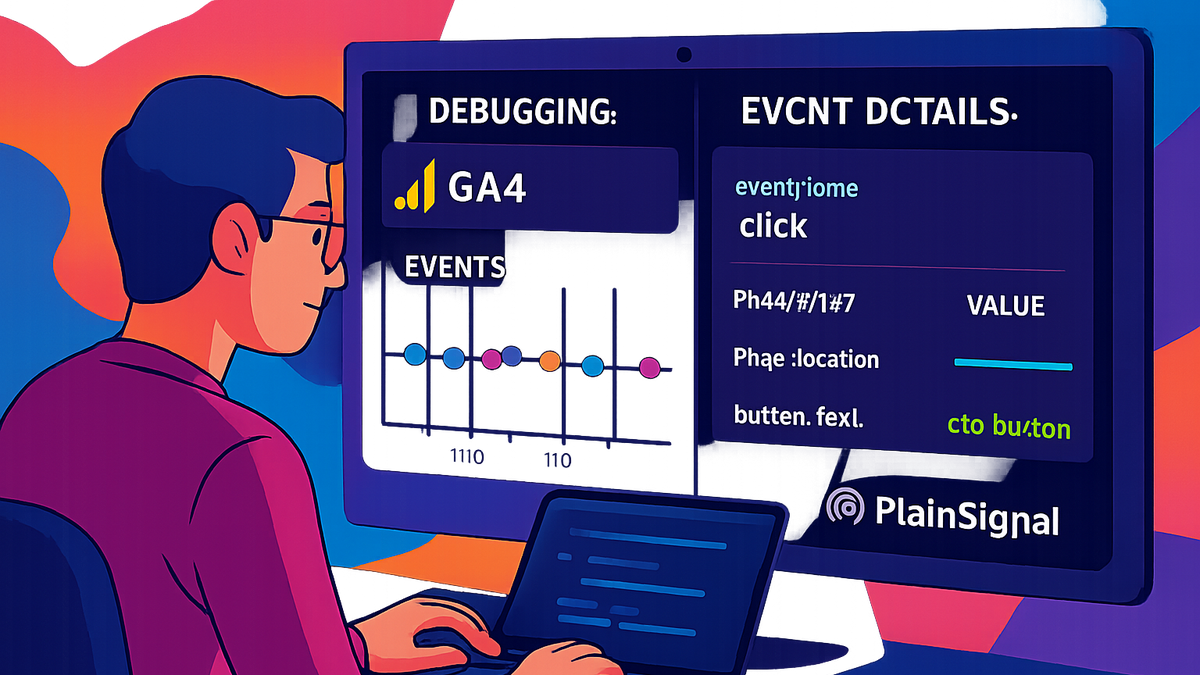
is processed for reporting. In Google Analytics 4 (GA4), DebugView is accessible under the Configure
section, showing a live timeline of events for sessions with debug mode enabled. In PlainSignal, a
cookie-free analytics tool, DebugView can be activated via a data-debug='true' attribute in
the tracking snippet, with events streaming directly into its dashboard. By providing immediate feedback
and detailed payload views, DebugView ensures analytics accuracy and accelerates debugging workflows.
Debugview
DebugView provides real-time visibility into analytics events for verifying and troubleshooting data collection in GA4 and PlainSignal.
Purpose and Benefits
DebugView offers several key advantages for analytics implementation and troubleshooting:
-
Immediate feedback
DebugView displays events as they occur, enabling you to verify that tracking fires correctly on user interactions in real time.
-
Error detection
Spot missing parameters, invalid event names, or technical issues before they impact your production data.
-
Performance monitoring
Understand event processing latencies and detect delays or failures in data collection pipelines.
Using DebugView in GA4
Google Analytics 4 provides a built-in DebugView that surfaces live events from debug-enabled sessions.
-
Enable debug mode
Append
?debug_mode=trueto your site URL or install the Google Analytics Debugger Chrome extension to send events in debug mode. -
Access debugview
In GA4, navigate to Configure > DebugView to see a live timeline of events for sessions tagged with debug mode.
-
Interpreting data
Use the timeline to observe event flow and click on events to view detailed parameters, user properties, and device info.
-
Event timeline
Shows a chronological sequence of events for the current debug session.
-
Parameter panel
Displays all event parameters and user properties associated with each event.
-
Using DebugView in PlainSignal
PlainSignal offers a lightweight, cookie-free analytics solution with its own DebugView for live event inspection.
-
Integrate debug script
Add the following tags to your site’s
<head>to enable debug mode in PlainSignal:<link rel='preconnect' href='//eu.plainsignal.com/' crossorigin /> <script defer data-do='yourwebsitedomain.com' data-id='0GQV1xmtzQQ' data-api='//eu.plainsignal.com' data-debug='true' src='//cdn.plainsignal.com/plainsignal-min.js'></script> -
View real-time events
Open the PlainSignal dashboard and select the DebugView tab to inspect incoming events, payloads, and timestamps.
-
Event payload
Review the JSON structure of each event, including name, properties, and metadata.
-
Network monitoring
Use your browser’s DevTools network tab to confirm hits are sent to
eu.plainsignal.com.
-
Common Use Cases
DebugView is valuable in scenarios where precise tracking validation and troubleshooting are required.
-
Tagging validation
Ensure tags configured in Google Tag Manager or other tag managers fire correctly and include expected data.
-
Parameter verification
Check that custom parameters, such as product IDs or user attributes, are recorded accurately.
-
Troubleshooting data discrepancies
Compare DebugView output against your production reports to identify missing events or sampling biases.
Best Practices
Follow these guidelines to get the most out of DebugView and maintain data integrity.
-
Use on development environments
Limit debug tracking to staging or local environments to avoid polluting your production analytics data.
-
Filter by session or user id
Apply filters in DebugView to isolate your own test sessions using user_pseudo_id or session_id.
-
Manage event volume
Disable debug mode when not actively testing to reduce noise and avoid potential throttling.