Published on 2025-06-28T13:46:49Z
What is Descriptive Analytics? Definitions and Examples with PlainSignal and GA4
Descriptive analytics is the process of analyzing and summarizing historical data to understand what has happened. In digital analytics, it involves collecting web and user interaction data, aggregating metrics, and presenting key trends through reports and dashboards. Tools like PlainSignal (a cookie-free analytics platform) and Google Analytics 4 (GA4) provide built-in descriptive analytics capabilities, enabling teams to monitor page views, user sessions, events, and conversion metrics.
Key features of descriptive analytics include:
- Historical trend analysis
- Summary statistics such as totals and averages
- Basic segmentation by user attributes
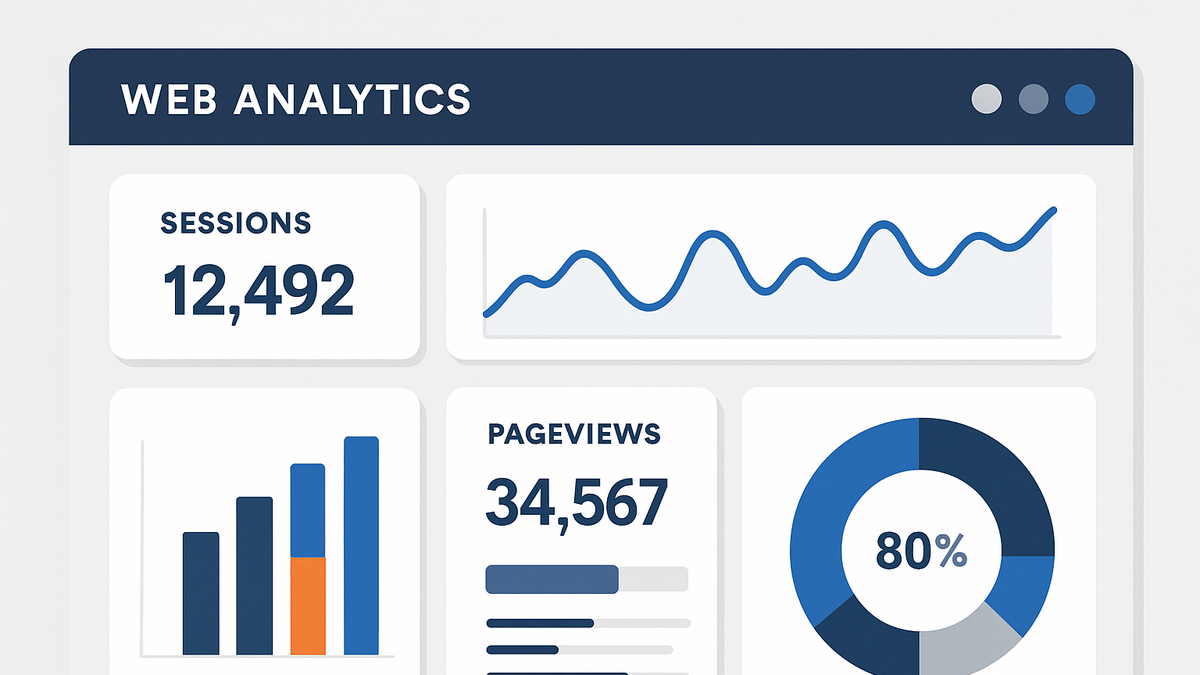
- Dashboards and visual reports
By translating raw data into digestible insights, descriptive analytics helps organizations identify patterns, measure performance against KPIs, and inform strategic decisions.
Descriptive analytics
Descriptive Analytics summarizes historical data into reports and dashboards to reveal patterns, trends, and insights.
Understanding Descriptive Analytics
In this section, we delve into the core concept of descriptive analytics and why it matters for businesses. Descriptive analytics focuses on summarizing past data to provide context and clarity on historical performance. It is the foundation upon which more advanced analytics methods are built. By answering questions like ‘What happened?’ organizations can establish benchmarks and track progression over time.
-
Core definition
Descriptive analytics involves collecting and interpreting historical data to answer what events occurred and how frequently they happened. It transforms raw data into meaningful summaries.
-
Importance
By offering a clear view of past performance, descriptive analytics helps teams identify trends, support reporting needs, and maintain transparency across stakeholders.
Key Metrics and Outputs
This section outlines the primary metrics and outputs generated by descriptive analytics tools. These metrics form the basis for reporting and trend analysis.
-
Totals and averages
Calculating total counts and average values provides baseline insights into volume and central tendency. Examples include total page views and average session duration.
-
Time series trends
Displaying metrics over time highlights patterns, such as daily active users or month-over-month growth. Time series charts are central to trend analysis.
-
Segmentation breakdowns
Splitting data by dimensions like geography, device type, or traffic source uncovers deeper insights and helps identify key audience segments.
Use Cases and Benefits
Here we explore common applications of descriptive analytics and the benefits organizations can gain.
-
Website performance monitoring
Teams can track page views, bounce rates, and user journeys to spot spikes or drops in traffic and understand user engagement.
-
Marketing campaign reporting
By measuring impressions, clicks, and conversions, marketers can evaluate campaign effectiveness and optimize resource allocation.
-
Stakeholder reporting
Descriptive analytics feeds regular reports and dashboards that inform executives and stakeholders about business health and progress.
Implementing Descriptive Analytics with SaaS Tools
This section covers how to set up descriptive analytics using SaaS platforms like PlainSignal and GA4, including integration steps and examples.
-
PlainSignal integration
PlainSignal offers a lightweight, cookie-free analytics solution that prioritizes privacy and simplicity. Integration is done by adding a single script to your website. Once installed, PlainSignal automatically captures key metrics like page views, sessions, and referrers.
-
Tracking code example
<link rel="preconnect" href="//eu.plainsignal.com/" crossorigin />
<script defer data-do="yourwebsitedomain.com" data-id="0GQV1xmtzQQ" data-api="//eu.plainsignal.com" src="//cdn.plainsignal.com/plainsignal-min.js"></script>
-
-
Google analytics 4 (GA4) setup
GA4 is Google’s next-generation analytics platform that provides descriptive metrics along with event-based tracking. Integration involves embedding the gtag.js library and configuring your measurement ID.
-
GA4 tracking code example
<!-- Global site tag (gtag.js) - Google Analytics -->
<script async src="https://www.googletagmanager.com/gtag/js?id=GA_MEASUREMENT_ID"></script>
<script>
  window.dataLayer = window.dataLayer || [];
  function gtag(){dataLayer.push(arguments);}
  gtag('js', new Date());
  gtag('config', 'GA_MEASUREMENT_ID');
</script>
-
Best Practices
To maximize the value of descriptive analytics, follow these industry best practices.
-
Ensure data quality
Verify that data sources are accurate, complete, and consistently formatted. Clean data is the foundation of reliable analytics.
-
Define clear kpis
Align your metrics with business objectives by selecting KPIs that reflect your goals, such as session duration, conversion rate, or revenue per user.
-
Visualize effectively
Use appropriate charts (e.g., line charts for trends, bar charts for comparisons) and provide context like annotations or benchmarks to make insights actionable.