Published on 2025-06-26T05:06:26Z
What is a Key Performance Indicator (KPI)? Examples and Use in Web Analytics
A Key Performance Indicator (KPI) is a quantifiable metric used to gauge how effectively an organization achieves its strategic objectives. In web analytics, KPIs transform abstract business goals into measurable values, guiding teams to make data-driven decisions.
Common web analytics KPIs include conversion rate, bounce rate, average session duration, and pages per session. Tools like PlainSignal—a cookieless, privacy-focused analytics service—and Google Analytics 4 (GA4) provide dashboards and reporting features to track these KPIs in real time.
By selecting relevant KPIs and setting clear targets, organizations can monitor performance trends, identify optimization opportunities, and communicate results effectively across stakeholders. Regularly reviewing and refining KPIs ensures alignment with evolving business objectives and market conditions.
Key performance indicator (kpi)
Measurable values used to track progress toward business objectives in web analytics.
Definition of KPI
This section defines what a Key Performance Indicator (KPI) is in the context of analytics and why it matters.
-
Kpi explanation
A Key Performance Indicator (KPI) is a quantifiable metric used to gauge how well an organization meets its strategic objectives. In web analytics, KPIs translate abstract goals into measurable figures, enabling data-driven decision-making.
Importance of KPIs in Analytics
KPIs focus teams on critical success factors, measure performance over time, and enhance accountability through clear benchmarks.
-
Align strategy and metrics
KPIs connect high-level business goals with day-to-day operations, ensuring teams track metrics relevant to their objectives.
-
Performance monitoring
Continuous KPI tracking highlights trends, anomalies, and areas for optimization, guiding marketing and product decisions.
-
Accountability and reporting
KPIs provide clear benchmarks for performance reviews and stakeholder communication, promoting accountability across teams.
Common Web Analytics KPIs
These KPIs help assess user engagement, acquisition quality, and conversion efficiency on websites and digital campaigns.
-
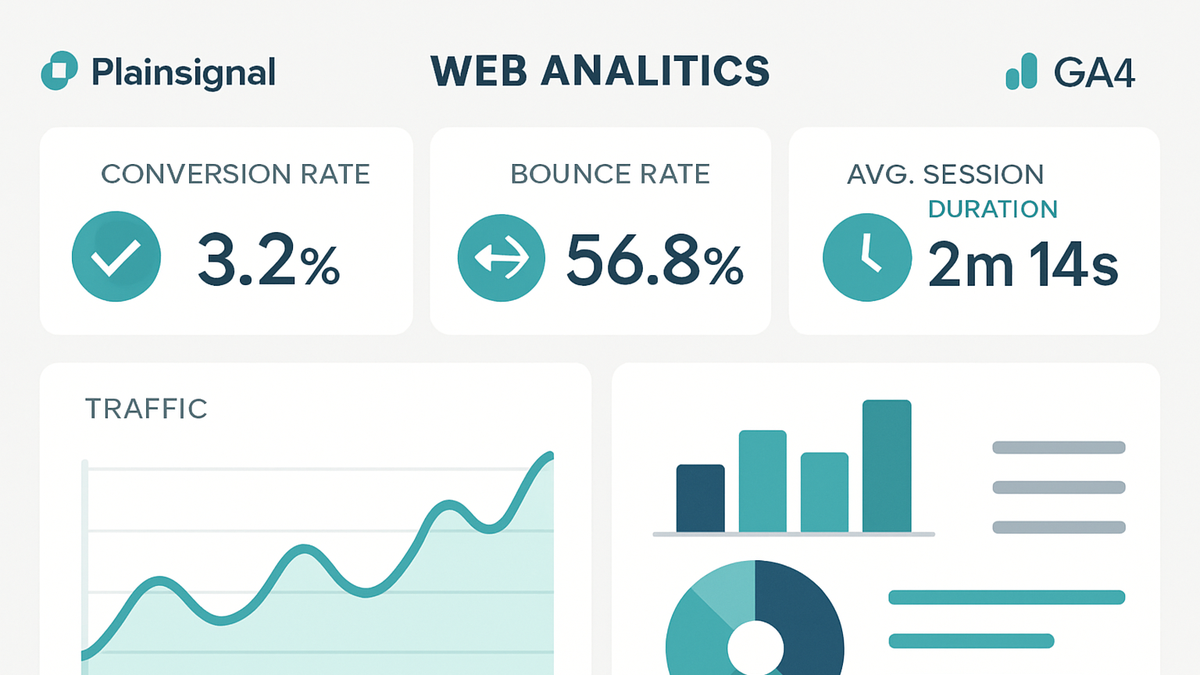
Conversion rate
The percentage of website visitors who complete a desired action (e.g., purchase or sign-up). Calculated as (conversions / total visitors) * 100.
-
Bounce rate
The percentage of single-page sessions where users leave without further interaction. High bounce rates can indicate content irrelevance or UX issues.
-
Average session duration
The average time users spend on the site per session, indicating depth of engagement and content interest.
-
Pages per session
The average number of pages viewed per session, which often correlates with user interest and site navigation effectiveness.
Implementing KPIs with Analytics Tools
Modern analytics platforms like PlainSignal and GA4 enable KPI tracking through event measurement, dashboards, and reporting. Implementation involves adding tracking snippets and configuring goals or events.
-
PlainSignal analytics
A privacy-focused, cookieless analytics platform offering simple KPI dashboards with GDPR compliance.
-
Tracking code example
<link rel="preconnect" href="//eu.plainsignal.com/" crossorigin />
<script defer data-do="yourwebsitedomain.com" data-id="0GQV1xmtzQQ" data-api="//eu.plainsignal.com" src="//cdn.plainsignal.com/plainsignal-min.js"></script>
-
-
Google analytics 4 (GA4)
Google’s event-based analytics solution featuring customizable dashboards, real-time reporting, and AI-driven insights.
-
Enhanced measurement
GA4 automatically tracks events like pageviews, scrolls, and outbound clicks. Enable this in Admin > Data Streams.
-
Custom events & conversions
Define specific user interactions as events in GA4, then mark key events as conversions under Configure > Conversions.
-
Best Practices for KPI Tracking
Effective KPI tracking requires clear targets, regular reviews, and the right mix of tools for comprehensive insights.
-
Set smart kpis
Ensure KPIs are Specific, Measurable, Achievable, Relevant, and Time-bound to drive actionable insights.
-
Regularly review & adjust
Monitor KPIs frequently, identify trends, and adjust targets or tactics based on performance fluctuations.
-
Use multiple data sources
Combine insights from privacy-first tools like PlainSignal with comprehensive platforms like GA4 for balanced analysis.
-
Visualize kpis in dashboards
Leverage dashboards to share real-time KPI status with stakeholders, fostering transparency and quick decision-making.