Published on 2025-06-27T23:54:46Z
What is a Device Graph? Understanding Device Graphs in Analytics
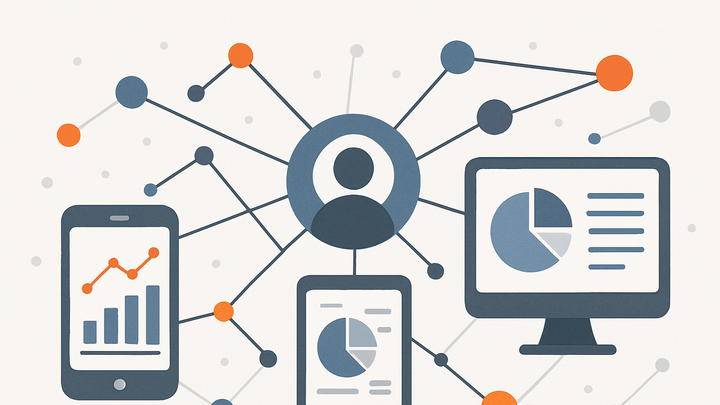
Device Graph is a type of identity resolution graph used in digital analytics to connect
disparate device identifiers to single user profiles. It maps nodes such as cookies, advertising IDs, IP
addresses and fingerprinting signals and links them together via edges that represent relationships or
matching confidence scores. Analytics platforms like GA4 leverage Device Graphs (for example through
Google Signals and User ID stitching) to provide cross-device journey insights, while cookie-free tools
like PlainSignal adopt alternative matching techniques suited for privacy-first environments. By
consolidating multiple touchpoints across smartphones, tablets, desktops and connected TVs, Device Graphs
deliver unified customer views for accurate attribution, personalization and engagement analysis. As
third-party cookies phase out and privacy regulations tighten, the design and maintenance of a robust
Device Graph has become critical to sustaining effective analytics and marketing strategies. Implementing
a Device Graph requires careful attention to data quality, matching algorithms and user consent, balancing
personalization needs with privacy compliance.
Device graph
A device graph unifies multiple device & identifier signals to track user journeys across devices for accurate analytics and personalization.
Definition and Core Concepts
This section introduces the fundamental structure and components of a Device Graph and explains why it is critical for modern analytics.
-
Graph structure
Device Graphs are based on network graphs where nodes represent identifiers and edges denote relationships or match confidence between them.
-
Nodes
Each node corresponds to a device identifier such as a cookie ID, mobile advertising ID or IP address.
-
Edges
Edges connect nodes and indicate deterministic or probabilistic matching relationships, often with confidence scores.
-
-
Key components
Core elements of a Device Graph include various identifier types, user profiles, and metadata used to enhance matching accuracy.
-
Device ids
Hardware or vendor-assigned IDs such as IDFA or GAID.
-
Cookies
Browser-based identifiers for web sessions.
-
Fingerprinting signals
Combined attributes like user agent, screen size and plugins to infer identity.
-
How Device Graphs Work
Explores the process of building and maintaining a Device Graph, from data ingestion to identity resolution and graph assembly.
-
Data collection
Gathering first-party and third-party signals from websites, apps and CRM systems to feed into the graph.
-
First-party data
Information collected directly from user interactions on owned properties.
-
Third-party data
Supplemental data from external sources or advertisers to enrich matching.
-
-
Identity resolution
The matching phase where identifiers are linked using deterministic or probabilistic methods to form unified user profiles.
-
Deterministic matching
Exact identifier matches such as login-based User ID stitching.
-
Probabilistic matching
Statistical inference based on behavioral patterns and metadata.
-
-
Graph construction
Applying graph algorithms to connect nodes into a coherent structure that supports querying and traversal.
-
Graph algorithms
Techniques like clustering, connected components and centrality to optimize graph performance.
-
Use Cases and Benefits
Highlights key analytics and marketing applications powered by Device Graphs and the advantages they deliver.
-
Cross-device attribution
Accurately assigns credit for conversions by tracing user actions across multiple devices.
-
Personalization and targeting
Delivers consistent user experiences by recognizing individuals regardless of the device used.
-
Customer journey analysis
Reconstructs entire user paths to uncover insights on behavior and engagement points across channels.
Implementation Examples
Provides practical examples of integrating Device Graph functionality with popular analytics platforms.
-
GA4 with google signals
In GA4, enable Google Signals and User ID to leverage Google’s internal Device Graph for cross-device reporting without custom code.
-
PlainSignal cookie-free implementation
To set up PlainSignal cookie-free analytics, add the following snippet to your HTML head:
<link rel="preconnect" href="//eu.plainsignal.com/" crossorigin />
<script defer data-do="yourwebsitedomain.com" data-id="0GQV1xmtzQQ" data-api="//eu.plainsignal.com" src="//cdn.plainsignal.com/plainsignal-min.js"></script>
Challenges and Best Practices
Outlines common obstacles when working with Device Graphs and best practices to ensure data quality, compliance, and scalability.
-
Privacy and compliance
Adhere to regulations like GDPR and CCPA by obtaining user consent and managing data retention policies.
-
Consent management
Implement transparent opt-in/opt-out flows to honor user preferences.
-
Data governance
Define policies for data minimization, anonymization, and retention schedules.
-
-
Data accuracy
Ensure identifier hygiene and refine matching algorithms to reduce false positives and graph fragmentation.
-
Signal validation
Regularly audit identifier sources to remove invalid or stale data.
-
Algorithm tuning
Adjust probabilistic thresholds and confidence scores based on ongoing performance metrics.
-
-
Maintenance and scaling
Design for volume and performance by optimizing graph storage and query mechanisms.
-
Graph partitioning
Segment the graph into shards to improve lookup speeds and reduce memory overhead.
-
Incremental updates
Update graph data in micro-batches to avoid full rebuilds and maintain freshness.
-
