Published on 2025-06-27T22:44:35Z
What is E-commerce Metrics? Examples of E-commerce Metrics
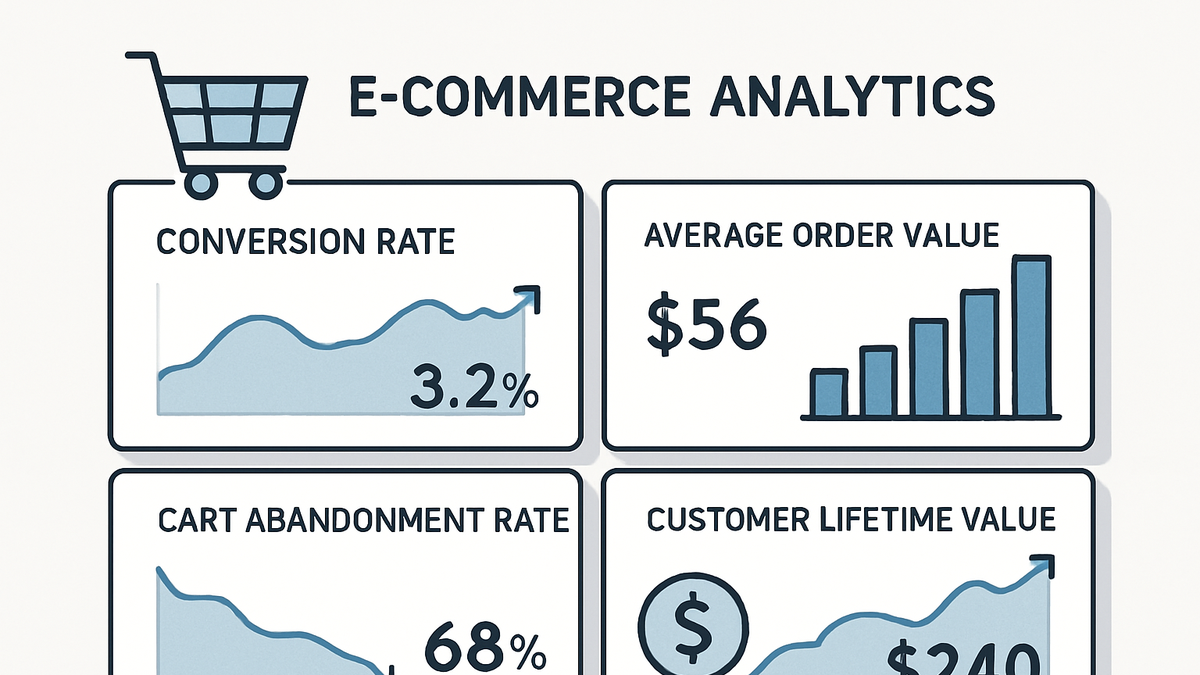
E-commerce metrics are quantitative indicators that help businesses measure and optimize the performance of their online stores. They cover all stages of the customer journey—from site visits and engagement to conversions, revenue, and post-purchase behavior. By analyzing these metrics, teams can identify strengths and weaknesses in marketing campaigns, user experience, and operational processes. Common e-commerce metrics include conversion rate, average order value (AOV), customer lifetime value (CLV), cart abandonment rate, and bounce rate. Leveraging tools like PlainSignal (a cookie-free, simple analytics platform) or Google Analytics 4 (GA4) enables retailers to collect, visualize, and act on this data in real time. Ultimately, e-commerce metrics empower data-driven decisions that drive growth, profitability, and customer satisfaction.
E-commerce metrics
Key performance indicators measuring online store performance—traffic, conversions, revenue, and customer behavior—to fuel data-driven growth.
Why E-commerce Metrics Matter
E-commerce metrics offer a snapshot of your store’s health, enabling you to spot trends, detect issues, and measure the impact of changes. They drive informed decisions by quantifying performance across marketing, sales, and user experience. Regular monitoring ensures you’re on track to meet business goals and can pivot quickly if metrics dip.
-
Performance monitoring
Track real-time and historical data on site traffic, sales, and user engagement to understand trends and seasonality.
-
Optimization and growth
Use metric insights to optimize marketing spend, A/B test site changes, and scale successful campaigns for sustainable growth.
Core E-commerce Metrics
These fundamental metrics measure key aspects of an online store’s performance. Understanding their definitions and calculations is the first step to meaningful analysis and optimization.
-
Conversion rate
The percentage of visitors who make a purchase during a session. It reflects how well your site turns traffic into customers.
-
Formula
(Number of Purchases / Number of Sessions) × 100
-
Why it matters
A higher conversion rate indicates effective UX, product-market fit, and marketing.
-
-
Average order value (aov)
The average amount spent by customers per transaction. It helps evaluate upselling, cross-selling, and pricing strategies.
-
Formula
Total Revenue / Number of Orders
-
Optimization tip
Bundle products or offer discounts on higher cart values to boost AOV.
-
-
Customer lifetime value (clv)
The total revenue a business can reasonably expect from a single customer account over time.
-
Estimation
Average Order Value × Purchase Frequency × Average Customer Lifespan
-
Use case
Guides customer acquisition spend by ensuring CAC remains below CLV.
-
-
Cart abandonment rate
The percentage of shoppers who add items to their cart but leave before completing checkout.
-
Formula
(Abandoned Carts / Initiated Checkouts) × 100
-
Reduction strategy
Simplify checkout flow and offer transparent shipping costs to lower abandonment.
-
-
Bounce rate
The percentage of single-page sessions where the user leaves without interacting further. High bounce rates can signal poor UX or mismatched traffic.
-
Formula
(Single-Page Sessions / Total Sessions) × 100
-
Analysis tip
Segment by landing page to identify underperforming entry points.
-
Implementing E-commerce Metrics with SaaS Tools
Tracking e-commerce metrics requires adding analytics code to your site and configuring events. Cookie-free solutions like PlainSignal and comprehensive platforms like GA4 both offer unique advantages.
-
PlainSignal setup
PlainSignal is a lightweight, cookie-free analytics tool that focuses on privacy compliance and simplicity. To install, insert the tracking snippet into your site’s HTML.
-
Code snippet
<link rel="preconnect" href="//eu.plainsignal.com/" crossorigin />
<script defer data-do="yourwebsitedomain.com" data-id="0GQV1xmtzQQ" data-api="//eu.plainsignal.com" src="//cdn.plainsignal.com/plainsignal-min.js"></script>
-
-
Google analytics 4 (GA4) setup
GA4 is Google’s latest analytics platform with advanced event-driven architecture. After adding the global site tag, configure e-commerce events:
-
Code snippet
<!-- Global site tag (gtag.js) - Google Analytics -->
<script async src="https://www.googletagmanager.com/gtag/js?id=G-XXXXXXXXXX"></script>
<script>
  window.dataLayer = window.dataLayer || [];
  function gtag(){dataLayer.push(arguments);}
  gtag('js', new Date());
  gtag('config', 'G-XXXXXXXXXX');
  // Example purchase event
  gtag('event', 'purchase', {currency: 'USD', transaction_id: 'T12345', value: 25.00});
</script>
-
Best Practices and Common Pitfalls
Maintaining reliable e-commerce analytics involves establishing clear objectives, focusing on relevant metrics, and regularly auditing your setup. Avoid getting distracted by vanity metrics that don’t drive action.
-
Define clear objectives
Align metrics with specific business goals, such as increasing revenue by X% or reducing cart abandonment.
-
Focus on actionable metrics
Prioritize metrics that directly inform strategy—like conversion rate or CLV—instead of superficial volume metrics.
-
Ensure data accuracy
Regularly test tracking implementations, validate event firing, and filter out bot or internal traffic.
-
Regular auditing
Schedule periodic reviews of your analytics configuration to catch errors or deprecated tags early.