Published on 2025-06-28T06:29:05Z
What is Factorial Design? Examples for Factorial Design
Factorial design is a structured experimentation method in analytics that tests two or
more variables (factors) and their combinations simultaneously. Instead of altering one element at a time,
factorial tests can reveal not only the main effect of each factor but also how factors interact
to influence outcomes. This approach is powerful for optimizing digital experiences, uncovering synergies
between page elements like headlines, button colors, or layouts. Tools like PlainSignal and
GA4 support factorial experiments by distributing users across all variation combinations and
collecting performance data. By analyzing both main effects and interaction effects, teams gain deeper
insights for data-driven optimizations.
Factorial design
An analytics method to test multiple variables and their interactions for data-driven optimization.
Understanding Factorial Design
Factorial design allows analysts to test multiple factors simultaneously to uncover both main effects and interaction effects. This method is more efficient than sequential one-variable-at-a-time tests when optimizing digital experiences. It matters because many website elements influence each other, and only factorial testing can reveal hidden synergies or conflicts between elements.
-
Basic principles
A factorial test varies each factor at predefined levels and runs every possible combination. This structure ensures that you can isolate the individual effect of each factor (main effect) and their combined influence (interaction effect).
-
Factors and levels
Factors are independent variables (e.g., button color), and levels are their variants (e.g., blue or green).
-
Full vs fractional designs
Full factorial tests include all possible combinations of factor levels; fractional designs run a subset to reduce complexity.
-
-
Interaction effects
Interaction effects occur when the effect of one factor depends on the level of another, revealing non-additive influences. Identifying interactions helps uncover nuanced user behaviors that single-factor tests might miss.
-
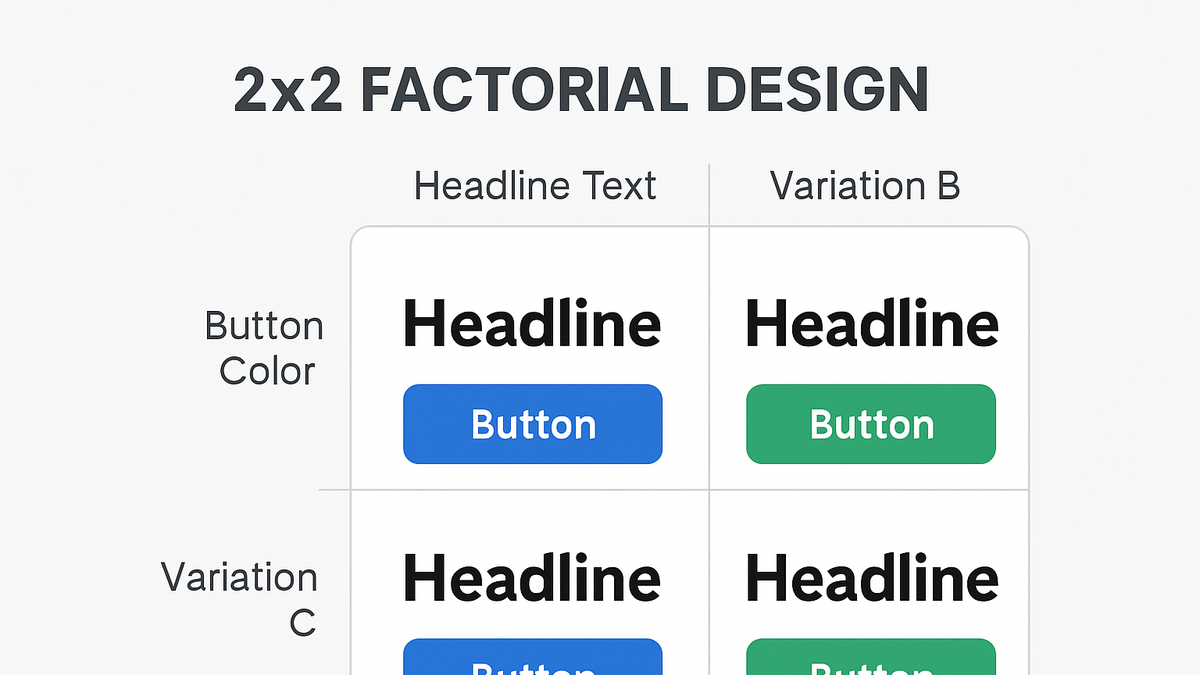
Example of interaction
In a 2x2 test, a red button might increase conversions only when paired with a certain headline, showing that color and text interact.
-
Implementing Factorial Design in Analytics Tools
Setting up factorial experiments requires proper tagging and configuration in your analytics platform. Below are examples for configuring tests in PlainSignal and GA4.
-
PlainSignal implementation
Use PlainSignal’s lightweight script to deploy a factorial test on your website. After adding the script, define each factor and its levels in the PlainSignal dashboard to start the experiment.
-
Code setup
Add the PlainSignal tracking code to your page header:
<link rel="preconnect" href="//eu.plainsignal.com/" crossorigin /> <script defer data-do="yourwebsitedomain.com" data-id="0GQV1xmtzQQ" data-api="//eu.plainsignal.com" src="//cdn.plainsignal.com/plainsignal-min.js"></script> -
Defining variations
In the PlainSignal dashboard, create variables for each factor (e.g., headline text, button color) and assign the levels. PlainSignal will automatically distribute visitors across all possible combinations.
-
-
GA4 implementation
In GA4, you can leverage Google Optimize or the built-in Experiments feature to conduct factorial tests. Use gtag.js for accurate event tracking of each variation.
-
Gtag.js setup
Load the GA4 gtag.js snippet in your site:
html <script async src="https://www.googletagmanager.com/gtag/js?id=G-XXXXXXX"></script> <script> window.dataLayer = window.dataLayer || []; function gtag(){dataLayer.push(arguments);} gtag('js', new Date()); gtag('config', 'G-XXXXXXX'); </script>ReplaceG-XXXXXXXwith your GA4 measurement ID. -
Experiment configuration
Within Google Optimize or GA4 Experiments, set up factors and levels, then tag variations using custom dimensions or event parameters. GA4 will record performance metrics for each combination.
-
Analyzing Results and Interactions
After data collection, it’s essential to separate main effects from interactions and validate statistical significance. Proper analysis ensures you draw accurate insights from your factorial experiment.
-
Main effects analysis
Compute the average difference in outcomes between levels of a single factor, aggregated across other factors.
-
Interaction effect interpretation
Assess whether the impact of one factor changes at different levels of another by comparing combinations. Visual tools like interaction plots can help interpret these effects.
-
Interaction plot
Plot each factor’s levels on separate lines to visualize how they diverge, indicating interaction strength.
-
-
Statistical significance
Use ANOVA or regression analysis to test if observed effects are unlikely due to chance. Ensure your test has adequate sample size for reliable results.
Best Practices and Considerations
Factorial tests can grow exponentially with each added factor, so planning and resource management are crucial. Follow best practices to maximize insights while maintaining test validity.
-
Sample size requirements
Larger test matrices need more traffic per combination. Calculate required sample sizes using power analysis to ensure statistical validity.
-
Avoiding overcomplexity
Limit factors to the most impactful ones to keep your design manageable. For many factors, consider a fractional factorial design to estimate key effects with fewer combinations.
-
Fractional factorial
Select a subset of combinations to reduce test volume while still estimating main effects and low-order interactions.
-
-
Choosing the right factors
Focus on elements with hypothesized impact on user behavior, such as messaging, layout, or call-to-action elements. Prioritize factors based on user research and past performance.