Published on 2025-06-28T04:27:42Z
What is Fill Rate? Examples of Fill Rate in Analytics
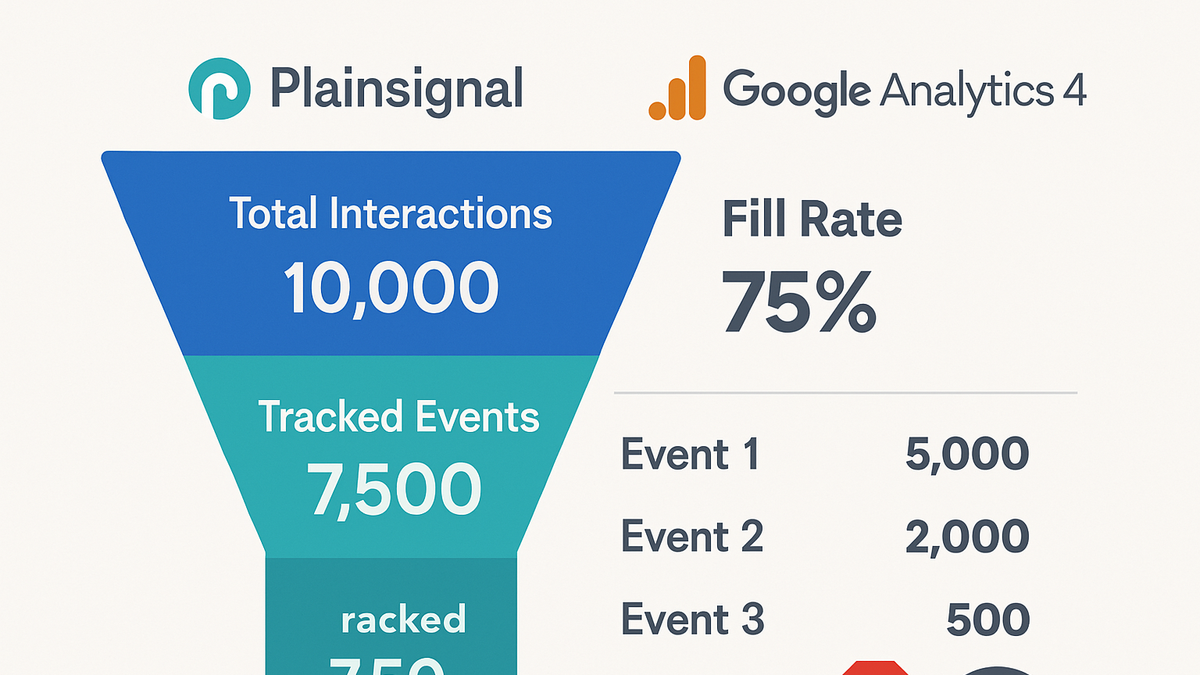
Fill Rate is a key metric in analytics that measures the proportion of user interactions (such as pageviews or ad requests) successfully captured by your tracking implementation relative to the total number of interactions that occurred. It helps you assess the completeness and accuracy of your data, ensuring you can trust the insights derived from analysis. In ad analytics, Fill Rate refers to the percentage of ad requests that were returned with an ad, which impacts ad revenue and campaign performance. In the context of web analytics, Fill Rate highlights gaps in data collection caused by factors such as script errors, network issues, or users blocking trackers. Tools like PlainSignal (a cookie-free simple analytics solution) and Google Analytics 4 (GA4) can both be used to monitor and calculate Fill Rate, enabling teams to identify and resolve tracking issues. Monitoring Fill Rate regularly helps maintain high-quality data streams and supports data-driven decision-making in marketing, product development, and business intelligence.
Fill rate
Percentage of analytics events or ad requests successfully tracked relative to total requests, indicating data completeness.
Why Fill Rate Matters
Fill Rate serves as a cornerstone metric for data trustworthiness and completeness. A high Fill Rate means your analytics tool is capturing the vast majority of user interactions, leading to more accurate insights and reliable decision-making. Conversely, a low Fill Rate uncovers gaps in tracking, which can skew reports and lead to misguided strategies. Monitoring Fill Rate helps identify underlying issues—such as script errors or blockers—before they compromise key metrics. Ultimately, Fill Rate ensures you are basing business and marketing decisions on comprehensive data.
-
Ensures data reliability
By tracking the ratio of captured to actual interactions, Fill Rate highlights missing data. A reliable Fill Rate means fewer blind spots in your analytics.
-
Supports informed decision-making
High Fill Rate builds confidence in reports and dashboards, enabling stakeholders to make strategies based on accurate and complete data.
How Fill Rate is Calculated
Fill Rate is computed by dividing the number of successfully captured events (or ad impressions) by the total number of interactions (or ad requests), then multiplying by 100. This section walks you through the formula and examples using PlainSignal and GA4.
-
Basic calculation
Fill Rate = (Captured Events ÷ Total Events) × 100. For ad analytics: Fill Rate = (Filled Ad Requests ÷ Total Ad Requests) × 100.
-
Example with PlainSignal
Using the PlainSignal tracking snippet:
<link rel="preconnect" href="//eu.plainsignal.com/" crossorigin />
<script defer data-do="yourwebsitedomain.com" data-id="0GQV1xmtzQQ" data-api="//eu.plainsignal.com" src="//cdn.plainsignal.com/plainsignal-min.js"></script>
If your site generates 1,000 pageviews but PlainSignal records 950 events, your Fill Rate is (950 ÷ 1,000) × 100 = 95%.
-
Example with google analytics 4
With GA4, you can compare raw events sent to Google’s servers versus events displayed in the UI or via API. For instance, if GA4 receives 10,000 events but you only see 9,600 in your report, Fill Rate = (9,600 ÷ 10,000) × 100 = 96%.
Factors Affecting Fill Rate
Several external and internal factors can impact your Fill Rate. Understanding these influences helps you diagnose issues in data collection or ad delivery.
-
Script blocking and ad blockers
Users’ privacy extensions or browser settings can block or delay analytics scripts, reducing the number of captured events.
-
Privacy extensions
Browser plugins like uBlock Origin or Privacy Badger can prevent scripts from loading.
-
Browser settings
Strict cookie or tracker blocking options in browsers can stop analytics scripts from firing.
-
-
Network latency and errors
Slow connections or server errors can interrupt the delivery of tracking requests to analytics endpoints.
-
Timeouts
Long server response times can cause requests to fail before completion.
-
Server downtime
Analytics servers or CDNs being unavailable can drop tracking hits.
-
-
Sampling and quotas
Platforms like GA4 may apply sampling or enforce hit quotas, which can omit some data points from reports.
-
Data sampling
When datasets exceed thresholds, GA4 might process a subset to improve performance.
-
Api limits
Exceeding daily API quotas can lead to dropped events or throttling.
-
Improving Fill Rate
Proactive measures and best practices can help maximize your Fill Rate and ensure comprehensive data capture.
-
Optimize tag implementation
Load analytics scripts asynchronously and place them in the <head> to minimize blocking issues.
-
Implement fallback tracking
Use server-side tracking or beacon API as a backup when client-side scripts fail.
-
Monitor and alert on errors
Set up error logging and alerts for script failures or high drop rates to address issues quickly.