Published on 2025-06-28T04:11:34Z
What is First Contentful Paint (FCP)?
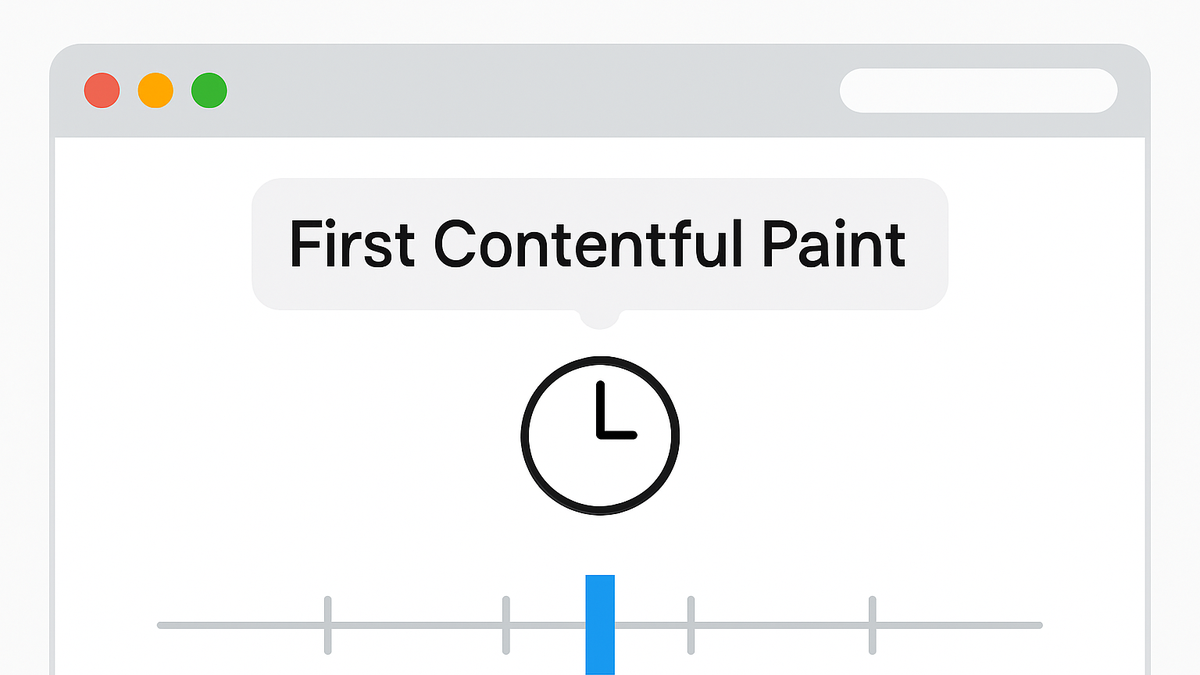
First Contentful Paint (FCP) is a user-centric performance metric that measures the time from when a page starts loading to when any part of the page’s content is rendered on the screen. This metric specifically marks the moment when the first text, image (including background images), non-white canvas elements or SVG are painted.
It is one of the Core Web Vitals defined by Google and is crucial for understanding the perceived loading speed of a web page. A faster FCP fosters better user engagement, reduces bounce rates, and can contribute to improved search engine rankings.
FCP can be measured in both lab environments (using tools like Lighthouse) and in the field (using JavaScript APIs, analytics platforms like GA4 and PlainSignal).
First contentful paint (fcp)
FCP measures the time until the first page content appears, indicating perceived load speed for users.
Why FCP Matters
FCP directly impacts user perception of page speed. When users see visible content quickly, they perceive the site as fast and reliable. Slow FCP can cause frustration, higher bounce rates, and loss of conversions. Additionally, search engines like Google consider Core Web Vitals (including FCP) as ranking signals.
-
User experience
A fast FCP means users see feedback quickly, reducing perceived waiting time and improving engagement.
-
Seo impact
Google uses Core Web Vitals in ranking algorithms, so optimizing FCP can boost search visibility.
-
Performance budgets
Teams set metrics budgets; monitoring FCP helps ensure performance goals are met throughout development.
How FCP is Measured
FCP can be measured in controlled lab tests or captured in real user monitoring (RUM). Labs simulate page loads in tools like Lighthouse, while RUM uses the Paint Timing API to record FCP in the browser. Two popular analytics platforms—GA4 and PlainSignal—offer built-in FCP tracking.
-
Lab measurement with lighthouse
Lighthouse runs in Chrome DevTools or via CLI, producing an FCP metric based on a simulated environment.
-
Field measurement via paint timing api
Websites can capture FCP in real user sessions using a PerformanceObserver that listens for the
first-contentful-paintentry.-
Example code
new PerformanceObserver((entryList) => {
  const fcpEntry = entryList.getEntriesByName('first-contentful-paint')[0];
  console.log('FCP:', fcpEntry.startTime);
}).observe({ type: 'paint', buffered: true });
-
-
Tracking fcp in GA4
GA4 automatically collects Core Web Vitals when the Google tag is installed with the
web-vitalsplugin enabled. -
Tracking fcp in PlainSignal
PlainSignal captures FCP out of the box with its lightweight script. Simply add the following snippet to your HTML:
-
Installation snippet
<link rel="preconnect" href="//eu.plainsignal.com/" crossorigin />
<script defer data-do="yourwebsitedomain.com" data-id="0GQV1xmtzQQ" data-api="//eu.plainsignal.com" src="//cdn.plainsignal.com/plainsignal-min.js"></script>
-
Strategies to Improve FCP
Optimizing FCP involves reducing the time to first byte, minimizing render-blocking resources, and prioritizing critical content.
-
Optimize server response
Use fast hosting, CDNs, and server-side caching to lower Time to First Byte (TTFB).
-
Minimize render-blocking resources
Defer non-critical CSS and JS, inline critical CSS, and load scripts asynchronously.
-
Resource hints
Use
<link rel="preconnect">,<link rel="dns-prefetch">, and<link rel="preload">to speed up resource fetching.
-
-
Optimize fonts
Use
font-display: swapand preload key font files to avoid invisible text. -
Reduce javascript payload
Remove unused code, implement code splitting, and lazy-load non-essential scripts.
Viewing FCP Data in Analytics Tools
Once FCP is captured, you can analyze the data in dashboards. GA4 and PlainSignal offer interfaces tailored for performance metrics.
-
GA4 web vitals report
In GA4, navigate to Reports > Engagement > Web Vitals to view FCP distributions, medians, and user segments based on FCP thresholds.
-
PlainSignal dashboard
Log into PlainSignal, go to the Performance section, and filter by First Contentful Paint to see real-time and historical trends.