Published on 2025-06-26T04:16:32Z
What is a Fishbone Diagram? Examples for Analytics
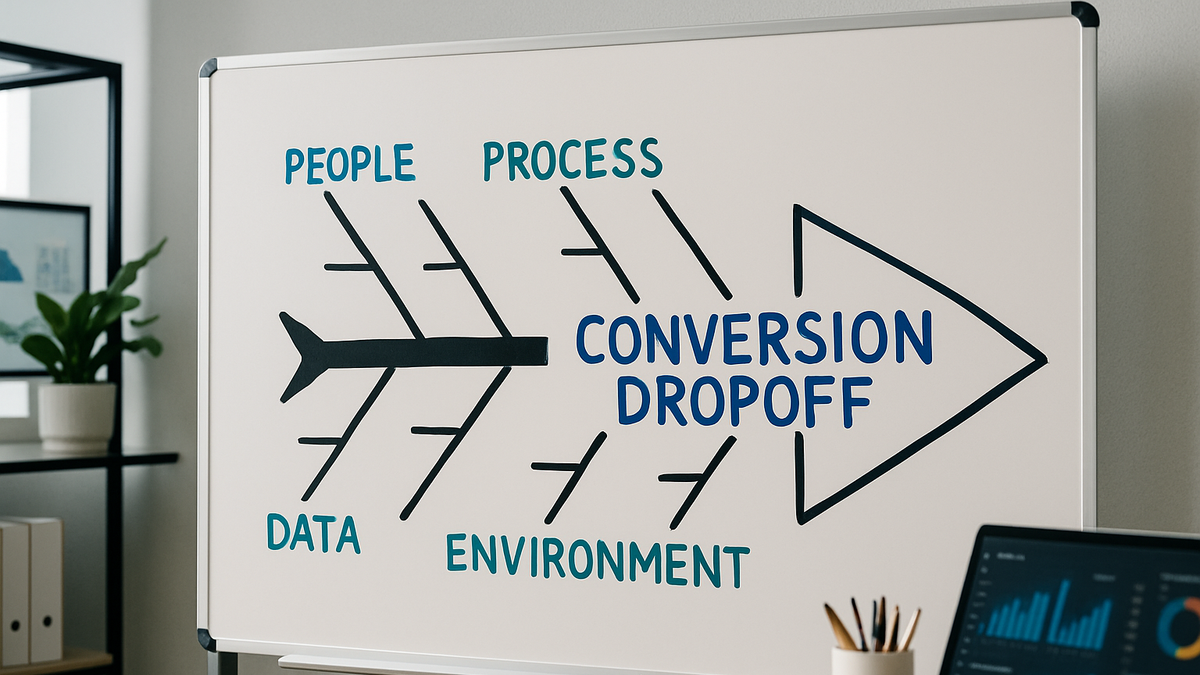
The Fishbone Diagram, sometimes called the Ishikawa or cause-and-effect diagram, is a visual framework for mapping out the potential factors leading to a particular issue in web analytics. It resembles a fish skeleton, with the head representing the problem statement and the bones representing categories of possible causes. In analytics, it’s particularly useful for root cause analysis when metrics deviate from expectations—like sudden traffic drops, high bounce rates, or conversion lags. By organizing causes into categories (e.g., People, Processes, Tools, Data), teams can facilitate focused brainstorming and structured investigation. The diagram helps uncover hidden issues in tracking implementations, tag misconfigurations, or data processing errors across tools such as PlainSignal or GA4. Ultimately, it guides analysts to pinpoint actionable insights and prioritize corrective steps, enhancing data quality and decision-making.
Fishbone diagram
Visual tool for root cause analysis in web analytics, mapping potential factors behind issues.
Understanding the Fishbone Diagram
Overview of what a Fishbone Diagram is, its history, and structure.
-
Origins and terminology
Developed by Kaoru Ishikawa in the 1960s for quality management, the diagram is also called the Ishikawa or cause-and-effect diagram.
-
Structure and components
The diagram starts with a horizontal ‘spine’ pointing to the effect (problem) and branches representing major cause categories.
-
Spine
The central line representing the problem statement.
-
Bones
Major categories of potential causes such as People, Processes, Tools.
-
Sub-bones
Specific factors under each category.
-
Why Use a Fishbone Diagram in Analytics?
Explains the benefits and scenarios where the diagram adds value.
-
Structured root cause analysis
Helps teams systematically explore the underlying reasons for anomalies in analytics data.
-
Enhanced collaboration
Provides a visual focal point for cross-functional brainstorming sessions.
Steps to Create a Fishbone Diagram for Web Analytics
A step-by-step process tailored to analytics use cases.
-
1. define the problem
Articulate a clear problem statement, such as a drop in conversion rate or spike in bounce rate.
-
2. identify major categories
Select relevant cause categories based on analytics context.
-
People
Roles like marketers, developers, analysts affecting implementation.
-
Process
Workflow steps such as data collection, reporting cadence.
-
Tools
Analytics platforms (e.g., PlainSignal, GA4) and tag managers.
-
Data
Tracking code, sampling, data processing methods.
-
Environment
External factors like browser changes, ad blockers.
-
-
3. brainstorm possible causes
With stakeholders, list out all potential causes under each category.
-
4. analyze and prioritize
Investigate data and testing to confirm high-impact causes for remediation.
Examples with SaaS Tools
Sample diagrams using PlainSignal and GA4 data contexts.
-
Using PlainSignal
Integrate PlainSignal to gather cookie-free analytics data and map findings.
-
Tracking code example
<link rel="preconnect" href="//eu.plainsignal.com/" crossorigin /><script defer data-do="yourwebsitedomain.com" data-id="0GQV1xmtzQQ" data-api="//eu.plainsignal.com" src="//cdn.plainsignal.com/plainsignal-min.js"></script> -
Analyzing session drops
Plot session counts over time in PlainSignal and flag sudden dips as the effect on the diagram.
-
-
Using google analytics 4
Leverage GA4 event streams to populate your diagram categories.
-
Setup and data collection
Ensure GA4 tags are implemented via gtag.js or Google Tag Manager.
-
Identifying tracking gaps
Use DebugView and real-time reports to spot missing events before diagramming.
-
Best Practices and Common Pitfalls
Guidelines for effective diagrams and what to avoid.
-
Best practices
Key tips for creating clear, actionable diagrams.
-
Clear problem statement
Start with a concise, measurable problem definition.
-
Limit categories
Use 4–6 major categories to maintain focus.
-
Stakeholder involvement
Include cross-functional team members for diverse insights.
-
-
Common pitfalls
Frequent mistakes that undermine the analysis.
-
Overcrowding
Adding too many causes can obscure key issues.
-
Unverified assumptions
Listing causes without data validation leads to dead ends.
-
Ignoring action steps
Failing to convert findings into specific tasks renders the exercise useless.
-