Published on 2025-06-22T05:12:22Z
What is Root Cause Analysis in Analytics? Definition and Examples
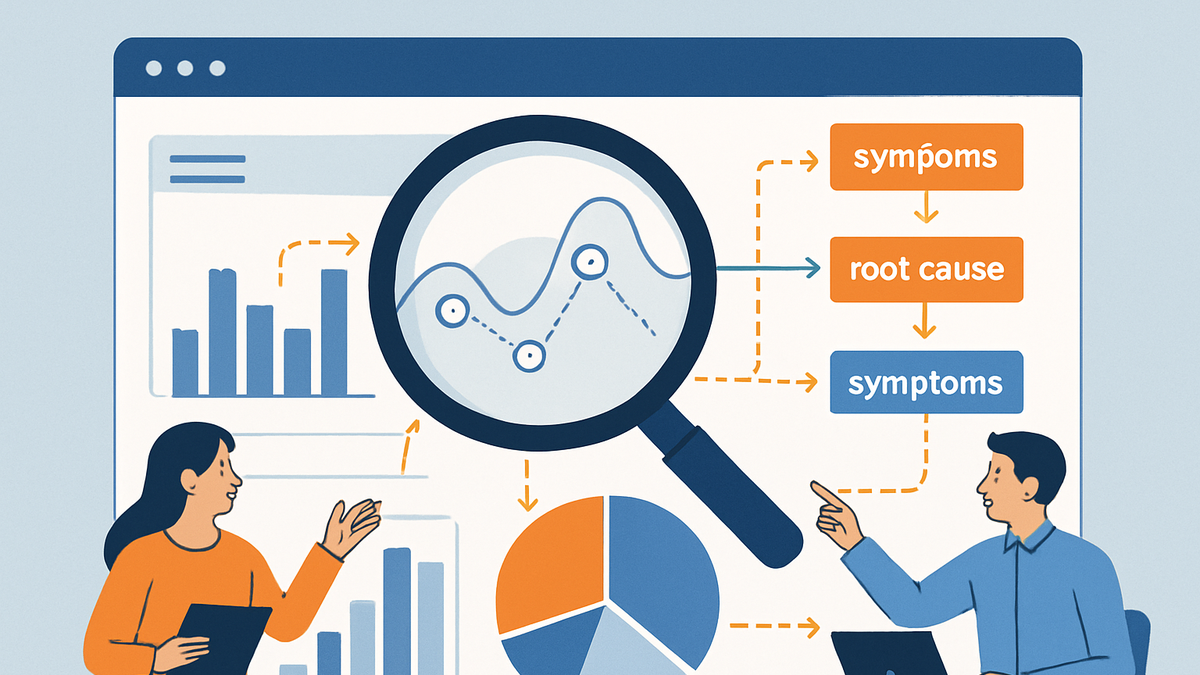
Root Cause Analysis (RCA) is a systematic approach used in analytics to identify the fundamental reasons behind data trends, anomalies, or performance issues. Instead of merely addressing symptoms—like a sudden drop in traffic or a decrease in conversion rate—RCA traces these symptoms back to their origin. By combining quantitative metrics and qualitative insights, analysts can test hypotheses, validate findings, and implement solutions that prevent recurrence. Modern analytics tools like PlainSignal and Google Analytics 4 enable seamless data collection, event tracking, and advanced segmentation to support robust RCA. PlainSignal’s cookie-free model reduces noise, while GA4’s machine-learning insights highlight anomalies and correlations. Ultimately, RCA drives more informed decision-making, optimizes user experiences, and enhances overall business performance.
Root cause analysis
Systematic method to identify and address the fundamental reasons behind analytics trends and anomalies.
Overview of Root Cause Analysis
Introduces the concept of RCA and its significance in analytics.
-
Definition
Root Cause Analysis (RCA) is a systematic process for uncovering the fundamental factors that contribute to a problem or unexpected trend in analytics data.
-
Purpose
The goal of RCA is to move beyond surface-level symptoms—such as traffic drops or conversion dips—and identify actionable, long-term solutions by addressing underlying causes.
Key Steps in Conducting RCA
Breaks down the common stages analysts follow to perform effective root cause analysis.
-
Define the problem
Quantify and clearly describe the issue affecting your key metrics or business objectives.
-
Collect metrics
Gather relevant data points in PlainSignal and GA4, such as sessions, conversion rates, or event counts.
-
Set scope
Determine the time frame, user segments, and channels impacted by the issue.
-
-
Gather and inspect data
Use analytics tools to collect detailed event and behavioral data to identify patterns and deviations.
-
PlainSignal
Leverage PlainSignal’s cookie-free tracking to obtain clean datasets without compromising user privacy.
-
GA4
Set up custom events and use Explorations reports to drill into anomalies.
-
-
Analyze contributing factors
Identify correlations, anomalies, and segments that may be driving the issue, using techniques like segmentation and cohort analysis.
-
Determine the root cause
Apply methods like the “5 Whys” or fishbone diagrams to trace back from observed symptoms to core issues.
-
Implement and validate solutions
Develop, execute, and monitor changes to confirm whether the identified root cause has been addressed successfully.
Using PlainSignal and GA4 in RCA
Examples of how modern analytics platforms can streamline each phase of root cause analysis.
-
PlainSignal example
Integrate PlainSignal for straightforward, privacy-focused tracking that simplifies data collection and anomaly detection.
-
Tracking code setup
<link rel="preconnect" href="//eu.plainsignal.com/" crossorigin /> <script defer data-do="yourwebsitedomain.com" data-id="0GQV1xmtzQQ" data-api="//eu.plainsignal.com" src="//cdn.plainsignal.com/plainsignal-min.js"></script> -
Clean data pipeline
PlainSignal automatically filters bots and respects privacy regulations for reliable analysis.
-
-
GA4 example
Use Google Analytics 4’s advanced modeling and exploration features to identify and visualize root causes.
-
Custom events
Configure event parameters to capture detailed user interactions.
-
Explorations reports
Utilize Explorations to segment data and highlight anomalies in real time.
-
Best Practices and Common Pitfalls
Guidelines to ensure effective RCA and avoid typical mistakes in the analysis process.
-
Validate data quality
Regularly audit your tracking implementation to prevent gaps, duplication, or sampling biases in your data.
-
Collaborate across teams
Engage stakeholders from product, marketing, and engineering to incorporate diverse perspectives and domain knowledge.
-
Avoid confirmation bias
Test multiple hypotheses with objective data to ensure you’re not forcing conclusions based on assumptions.
-
Document findings thoroughly
Keep detailed records of your analysis steps, decisions, and outcomes to inform future investigations.