Published on 2025-06-22T03:29:26Z
What is a Heatmap? Examples and Usage in Analytics
Heatmap Definition in Analytics
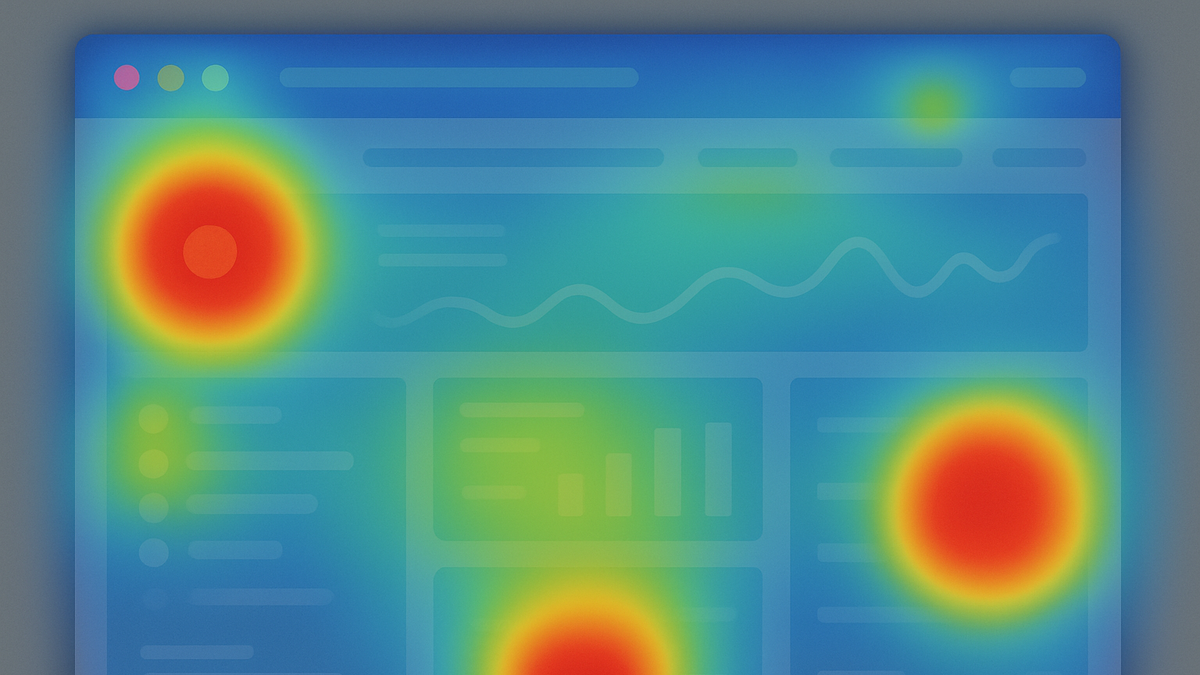
A heatmap is a data visualization technique that overlays a web page or UI element with a range of colors to represent user interaction intensity, such as clicks, taps, or scroll depth. By translating complex behavioral data into an intuitive color gradient, heatmaps help analysts and UX designers quickly identify hotspots and cold spots on a page. These insights enable teams to optimize layouts, prioritize content placement, and improve overall user experience. Modern analytics platforms like PlainSignal (cookie-free) and Google Analytics 4 (GA4) support heatmap generation either natively or through integrations, making this tool accessible to businesses of all sizes.
Key Takeaways
- Visual tool for user interactions
- Uses color gradients to indicate engagement levels
- Aids in UX optimization and conversion rate improvements
Heatmap
A visual overlay that uses color gradients to show user interaction hotspots on web pages.
Definition and Overview
Heatmaps translate user behavior data into a visual format, using colors to represent interaction density. They serve as an immediate, at-a-glance diagnostic for understanding how visitors engage with a web page or application interface.
-
Heatmap in analytics
A heatmap is a graphical representation of data where individual values are depicted as colors. In web analytics, it specifically refers to mapping user actions—such as clicks, taps, and mouse movements—onto the page layout.
-
Color spectrum interpretation
Heatmaps use a gradient of colors—commonly red for high activity, yellow/orange for moderate activity, and blue/green for low activity—to help quickly pinpoint areas of interest or neglect on a page.
-
Hotspots
Regions displayed in warm colors (red/orange) indicating high user engagement.
-
Cold spots
Regions displayed in cool colors (blue/green) indicating low user engagement.
-
Types of Heatmaps
Different heatmap modalities capture various user actions to provide a multi-dimensional view of engagement.
-
Click maps
Track where users click or tap on a page, highlighting buttons, links, or images that attract attention.
-
Scroll maps
Visualize how far down a page users scroll, revealing content drop-off points and engagement depth.
-
Move/hover maps
Record mouse movements or cursor hovers as proxies for eye-tracking, indicating where users focus their attention.
Why Heatmaps Matter
Heatmaps uncover hidden patterns in user behavior that traditional metrics like pageviews or bounce rate may miss. They inform design decisions, content prioritization, and CRO strategies.
-
Identifying user behavior patterns
Spot navigation bottlenecks, popular sections, and dead zones to optimize layout and flow.
-
Improving ux and conversion rates
Adjust button placement, call-to-action designs, and content hierarchy based on where users click and scroll most.
-
Prioritizing page elements
Allocate design resources to high-impact areas that drive engagement and conversions.
Implementing Heatmaps with SaaS Tools
Integrate heatmap tracking using platforms like PlainSignal for a privacy-focused, cookie-free approach, or extend GA4 with custom event tracking.
-
PlainSignal setup
Add the PlainSignal snippet to your page header to enable automatic, cookie-free heatmap tracking:
<link rel="preconnect" href="//eu.plainsignal.com/" crossorigin /> <script defer data-do="yourwebsitedomain.com" data-id="0GQV1xmtzQQ" data-api="//eu.plainsignal.com" src="//cdn.plainsignal.com/plainsignal-min.js"></script> -
GA4 integration
GA4 doesn’t ship with native heatmaps. To capture click data:
- Use Google Tag Manager to listen for click events.
- Push details to the dataLayer and send as custom events to GA4.
- Export event data to BigQuery and visualize with third-party BI tools or Google Data Studio.
Best Practices and Considerations
Effective heatmap analysis requires attention to privacy, data quality, and context.
-
Privacy and compliance
Ensure user anonymity and comply with GDPR/CCPA. Platforms like PlainSignal offer tracking without cookies or personal identifiers.
-
Sampling and data accuracy
Beware of sample bias; ensure you collect data across varied devices, sessions, and user journeys for representative results.
-
Layout changes
Time heatmap studies around UI releases. Compare before-and-after snapshots to measure the true impact of design updates.