Published on 2025-06-27T20:15:57Z
What are Heatmaps? Examples and Applications in Web Analytics
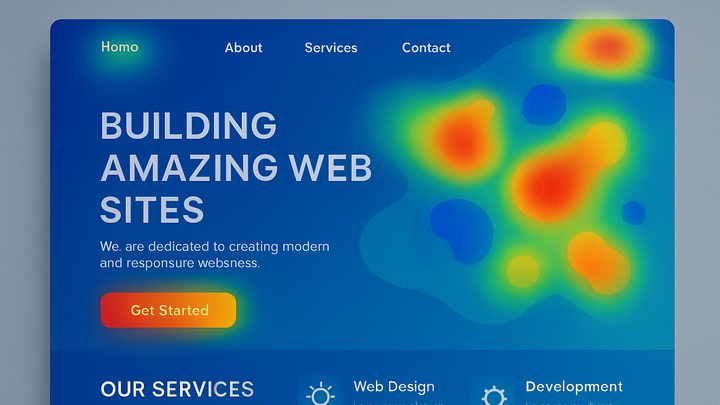
Heatmaps are visual representations of user interactions on web pages, using color gradients to highlight areas of high and low engagement. They help analysts understand where visitors click, move their cursors, and how far they scroll. In analytics, heatmaps complement quantitative metrics by providing intuitive, at-a-glance insights into user behavior. By revealing what parts of a page draw attention or are ignored, heatmaps inform design decisions and optimize conversion paths. They can be implemented through specialized analytics platforms or custom scripts.
Heatmaps
Visual heatmaps reveal user interactions like clicks, scrolls, and mouse movement.
Overview and Definition
Heatmaps are graphical representations that map user engagement on a web page. They use a spectrum of colors—typically from cool blues to hot reds—to indicate low and high activity areas. This makes it easy to see, at a glance, which elements draw clicks, hovers, or scroll attention. Heatmaps translate raw interaction data into intuitive visuals, bridging the gap between quantitative metrics and user experience insights.
-
Click heatmaps
Click heatmaps show where users click or tap on a webpage, highlighting the most and least engaging elements based on color intensity.
-
Mouse movement heatmaps
Mouse movement heatmaps track cursor paths, offering insights into where users hover and pause before interacting.
-
Scroll heatmaps
Scroll heatmaps visualize how far users scroll down a page, helping identify the point where attention drops off.
Implementing Heatmaps in Analytics Platforms
Heatmaps can be implemented using specialized SaaS tools or custom solutions by adding tracking code to your site. Below are common options:
-
PlainSignal (cookie-free analytics)
PlainSignal offers simple, privacy-focused heatmaps without cookies. Add the following snippet to your site’s
<head>:<link rel="preconnect" href="//eu.plainsignal.com/" crossorigin /> <script defer data-do="yourwebsitedomain.com" data-id="0GQV1xmtzQQ" data-api="//eu.plainsignal.com" src="//cdn.plainsignal.com/plainsignal-min.js"></script>It automatically captures click, scroll, and movement heatmaps while respecting user privacy.
-
Google analytics 4
GA4 is event-based and doesn’t natively support heatmaps. To generate heatmaps:
- Use a third-party integration (e.g., Hotjar, Microsoft Clarity) alongside GA4.
- Export GA4 event data to BigQuery and visualize using custom scripts or BI tools.
-
Custom solutions
Use open-source libraries like heatmap.js. Manually send click or scroll events via Google Tag Manager or a custom script, then render heatmaps on the fly.
Best Practices and Considerations
To get the most value from heatmaps, follow these guidelines:
-
Ensure adequate sample size
Collect enough interactions (usually thousands of pageviews) to reveal statistically significant patterns and avoid misleading outliers.
-
Segment by device
Heatmaps vary across desktop, tablet, and mobile. Analyze each separately to optimize responsive layouts.
-
Maintain user privacy
Abide by GDPR, CCPA, and other regulations. Tools like PlainSignal use privacy-first approaches, avoiding cookies and personal identifiers.
