Published on 2025-06-26T05:08:46Z
What is Hierarchical Clustering? Examples in Analytics
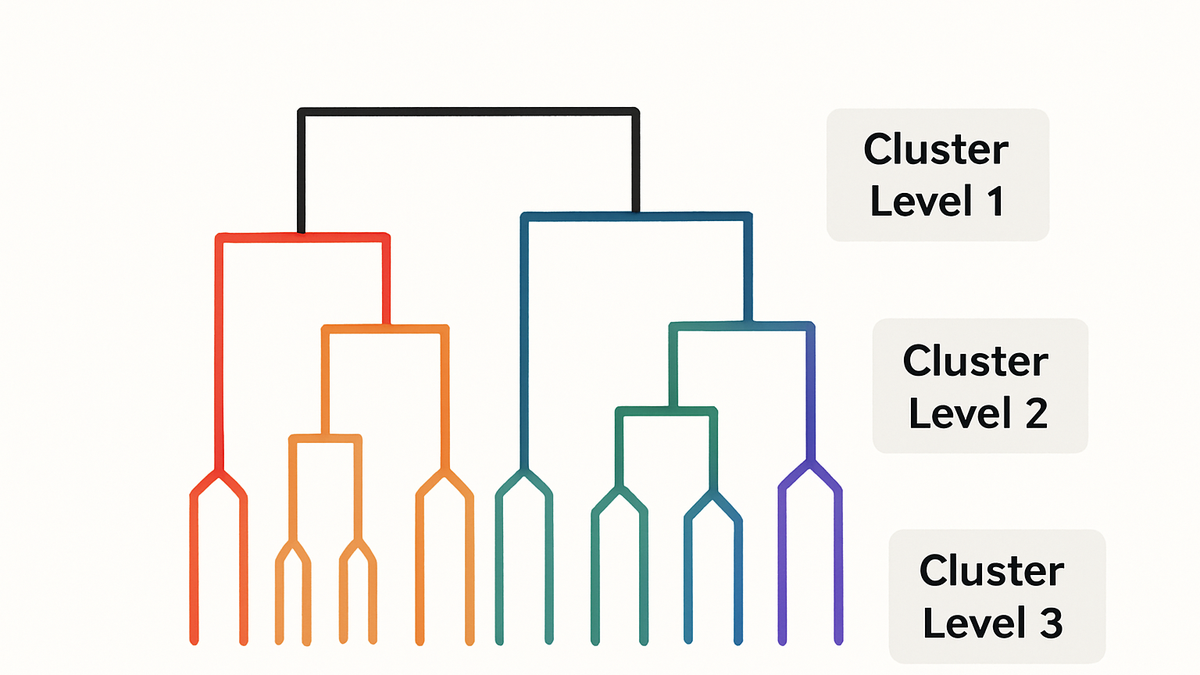
Hierarchical clustering is an unsupervised machine learning technique used in analytics to group similar data points into nested clusters. Instead of specifying the number of clusters in advance, it builds a hierarchy of clusters by either agglomeratively merging or divisively splitting data points. This approach helps analysts discover natural groupings and sub-groupings within datasets such as user sessions, customer behavior, or product interactions. By visualizing the results as dendrograms, stakeholders can intuitively understand how clusters relate and decide on the optimal level of segmentation. Hierarchical clustering is particularly useful when analysts want to explore the data structure without prior assumptions about cluster counts.
Hierarchical clustering
Hierarchical clustering groups data points into nested clusters, offering intuitive dendrogram visualizations for analytics insights.
Why Hierarchical Clustering Matters in Analytics
Hierarchical clustering reveals insights into data structure without requiring a predefined number of clusters. It uncovers nested patterns from broad group distinctions down to fine-grained segments, aiding in exploratory analysis and strategic decision-making.
-
Unsupervised exploration
Automatically discovers natural groupings in your data, making it ideal for exploratory stages when you don’t know how many clusters to expect.
-
No need to predefine k
Unlike k-means clustering, hierarchical methods do not require specifying the number of clusters upfront, offering flexibility to cut the tree at different levels.
-
Visual insights with dendrograms
Dendrograms visually represent the merging or splitting process, allowing analysts to see the relationships between clusters and decide the optimal segmentation point.
Applying Hierarchical Clustering with PlainSignal and GA4
To apply hierarchical clustering in web analytics, start by collecting behavioral data with tools like PlainSignal or GA4. Export session-level metrics and user attributes, then use statistical software or cloud data warehouses to perform clustering.
-
Embedding PlainSignal tracking
Add the PlainSignal snippet to capture anonymous, cookie-free user data in a compliance-friendly way:
<link rel="preconnect" href="//eu.plainsignal.com/" crossorigin /> <script defer data-do="yourwebsitedomain.com" data-id="0GQV1xmtzQQ" data-api="//eu.plainsignal.com" src="//cdn.plainsignal.com/plainsignal-min.js"></script> -
Integrating GA4 data
Use Google Analytics 4 to collect detailed event data and export it to BigQuery. Combine metrics like session duration, pageviews, and custom user properties for a rich feature set.
Interpreting Dendrograms and Clusters
After computing hierarchical clusters, interpret the resulting dendrogram to determine meaningful cut-off points and validate cluster stability. Leverage cluster insights to inform personalization, targeting, or product development.
-
Choosing cutoff levels
Select a height in the dendrogram to ‘cut’ the tree based on desired granularity. Lower cuts yield more clusters; higher cuts yield broader groupings.
-
Validating cluster quality
Use metrics like silhouette score or cophenetic correlation to assess how well the cluster assignments reflect data similarity.
-
Leveraging clusters for action
Apply identified clusters to segment users for targeted marketing, personalization strategies, or feature rollout experiments.