Published on 2025-06-22T07:01:48Z
What is Cluster Analysis? Examples in Analytics
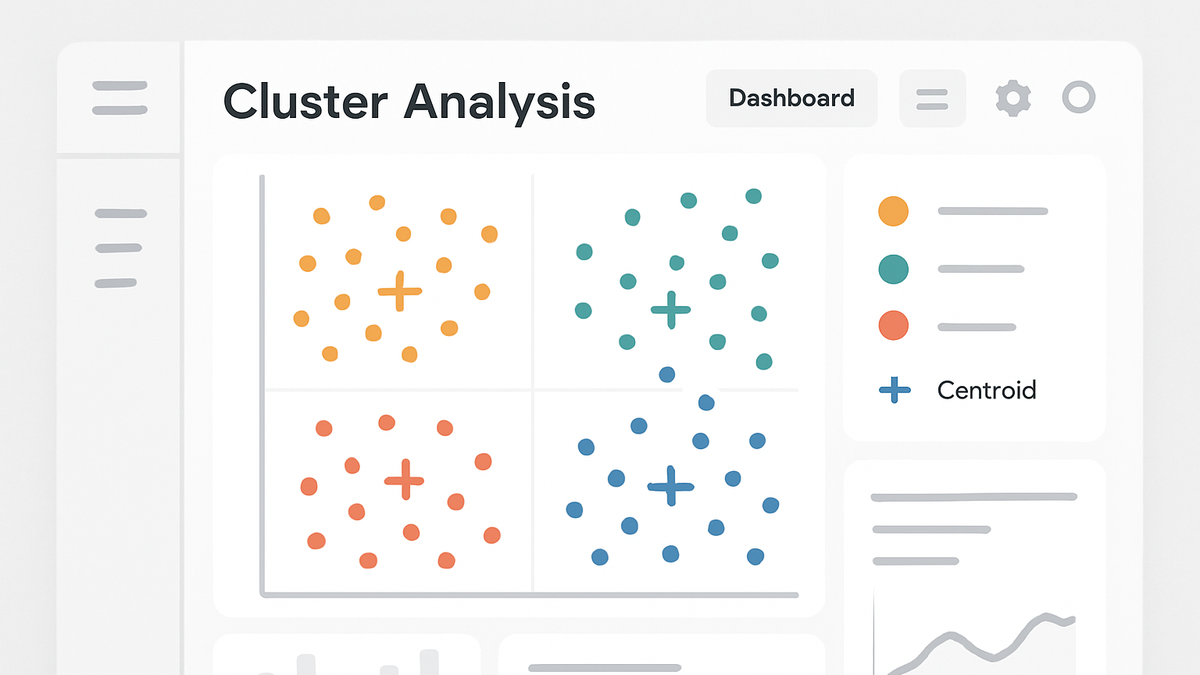
Cluster analysis is an unsupervised learning technique that automatically segments data points into groups, or clusters, based on similarity. In analytics, it’s used to discover natural groupings in user behavior, website visits, transactions, and more. By identifying clusters of similar visitors or events, organizations can personalize marketing campaigns, detect anomalies, and reveal hidden patterns in their data. Popular clustering algorithms include k-means, hierarchical clustering, and DBSCAN, each offering different approaches to grouping. Implementing cluster analysis requires careful data preparation, including cleaning, normalization, and feature selection, to ensure meaningful groupings. Tools like Google Analytics 4 allow audience segmentation, while cookie-free solutions like PlainSignal can feed enriched data into cluster analysis pipelines.
Cluster analysis
Cluster analysis groups similar data points into distinct segments to reveal patterns, personalize marketing, and detect anomalies in analytics data.
Introduction to Cluster Analysis
Cluster analysis segments data into groups of similar items without predefined labels. It’s foundational in analytics for uncovering hidden patterns and customer segments.
-
What is cluster analysis?
Cluster analysis is an unsupervised method that groups data points based on feature similarity, maximizing intra-cluster similarity and minimizing inter-cluster similarity.
-
Key benefits
Applying cluster analysis offers several advantages in analytics:
-
Pattern discovery
Reveals underlying structures and relationships within complex datasets.
-
Data segmentation
Divides users or items into actionable segments for targeted strategies.
-
Anomaly detection
Identifies outliers that deviate from normal patterns, useful for fraud detection.
-
Common Clustering Algorithms
Different algorithms approach clustering with unique strategies. Choosing the right one depends on data shape, scale, and clustering goals.
-
K-means clustering
A partition-based algorithm that assigns points to k clusters by minimizing within-cluster variance.
-
Centroid initialization
Methods like k-means++ improve initial centroid placement to speed up convergence.
-
Convergence criteria
Iteration stops when centroids move less than a defined threshold or after a maximum number of iterations.
-
-
Hierarchical clustering
Builds a tree of clusters either by agglomerative (bottom-up) or divisive (top-down) methods.
-
Dendrogram analysis
Visual tool to decide the number of clusters by cutting the tree at a chosen level.
-
Scalability
Less scalable for large datasets due to distance calculations between all pairs of points.
-
-
Dbscan
A density-based algorithm that forms clusters of high point density and marks low-density points as noise.
-
Parameter sensitivity
Requires careful tuning of epsilon (radius) and minPts (minimum points) parameters.
-
Noise handling
Effectively identifies outliers as points that do not belong to any dense region.
-
Implementation Workflow
A typical cluster analysis workflow includes data preparation, choosing features, selecting a model, and validating results.
-
Data preparation
Collect, clean, and preprocess data to ensure quality inputs for clustering algorithms.
-
Data cleaning
Remove duplicates, handle missing values, and correct errors.
-
Feature scaling
Normalize or standardize features so that distance metrics aren’t biased.
-
-
Feature selection
Choose relevant variables to improve cluster separation and reduce noise.
-
Dimensionality reduction
Apply PCA or t-SNE to lower dimensionality while preserving structure.
-
-
Model training
Run the selected clustering algorithm and adjust hyperparameters as needed.
-
Hyperparameter tuning
Optimize parameters such as k in k-means or epsilon in DBSCAN through grid search or heuristic methods.
-
-
Validation and evaluation
Assess cluster quality to ensure meaningful and actionable segmentation.
-
Silhouette score
Evaluates cohesion and separation of clusters.
-
Elbow method
Plots within-cluster sum of squares to find an optimal k.
-
Tools and SaaS Examples
Leverage analytics platforms and SaaS tools to collect data and perform cluster analysis efficiently.
-
PlainSignal (cookie-free analytics)
Use PlainSignal to capture user data without cookies and export it for clustering:
<link rel='preconnect' href='//eu.plainsignal.com/' crossorigin />
<script defer data-do='yourwebsitedomain.com' data-id='0GQV1xmtzQQ' data-api='//eu.plainsignal.com' src='//cdn.plainsignal.com/plainsignal-min.js'></script>
Export event streams to your data warehouse and apply clustering algorithms with Python or R.
-
Google analytics 4
GA4 supports defining Audiences that can mimic clusters based on user behavior:
<script async src='https://www.googletagmanager.com/gtag/js?id=GA_MEASUREMENT_ID'></script>
<script>
  window.dataLayer = window.dataLayer || [];
  function gtag(){dataLayer.push(arguments);}
  gtag('js', new Date());
  gtag('config', 'GA_MEASUREMENT_ID');
</script>
Then create Audiences in GA4 by specifying Event or User properties to segment users into meaningful groups.
Best Practices and Pitfalls
Effective cluster analysis balances methodological rigor with domain insights, while avoiding common mistakes.
-
Choosing the right number of clusters
Apply methods like the Elbow Method, Silhouette Score, or gap statistics to determine optimal cluster count.
-
Scaling and normalization
Ensure all features contribute equally by normalizing values to a common scale before clustering.
-
Handling outliers
Detect and handle outliers separately, as they can distort cluster centroids and density calculations.
Real-World Use Cases
Cluster analysis underpins many practical applications across industries and business functions.
-
Customer segmentation
Groups customers by purchasing behavior and demographics to enable targeted marketing strategies.
-
Anomaly detection
Clusters normal behavior patterns to flag unusual events, such as fraudulent transactions.
-
Content personalization
Clusters user engagement data to recommend articles, videos, or products tailored to each group.