Published on 2025-06-27T21:15:59Z
What is DBSCAN? (Density-Based Spatial Clustering of Applications with Noise)
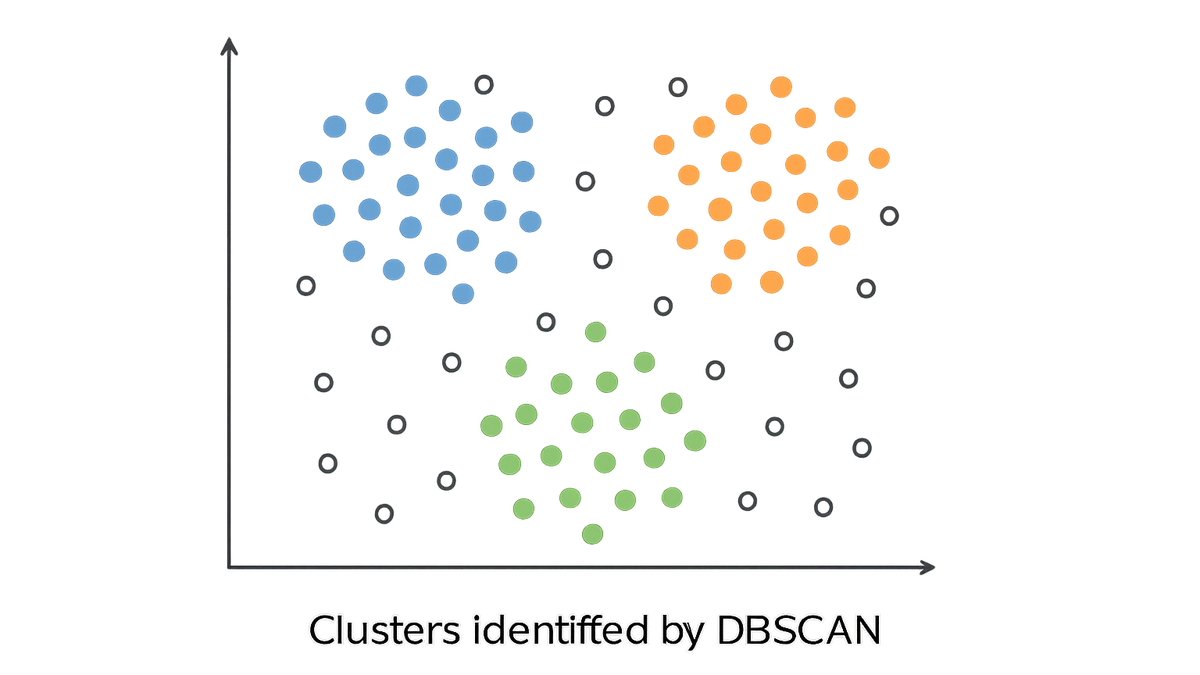
DBSCAN (Density-Based Spatial Clustering of Applications with Noise) is a popular unsupervised algorithm used in analytics to identify clusters of similar data points based on density. It groups together points that are closely packed (high density) and marks points in low-density regions as outliers or noise. DBSCAN requires two key parameters: epsilon (ε), which defines the neighborhood radius, and MinPts, the minimum number of points to form a dense region. Because it can discover clusters of arbitrary shapes and automatically determine the number of clusters, DBSCAN is especially valuable for tasks like user segmentation and anomaly detection in web analytics. Its resilience to noise and ability to handle non-linear cluster boundaries make it a powerful tool for modern data-driven businesses. You can apply DBSCAN to event data from platforms like GA4 or PlainSignal by exporting the raw events and running the clustering analysis in Python or other environments.
Dbscan
Unsupervised density-based clustering that discovers arbitrarily shaped groups and detects noise without needing a preset number of clusters.
Overview of DBSCAN
DBSCAN is a density-based clustering algorithm that groups points closely packed in high-density regions and identifies low-density points as noise. It relies on two parameters: epsilon (ε) and MinPts. Epsilon defines the radius of the neighborhood around a point, while MinPts sets the minimum number of points required to form a dense region. Unlike K-means, DBSCAN does not require the number of clusters beforehand and can discover clusters of arbitrary shapes. Its ability to handle noise and outliers makes it particularly useful in real-world analytics scenarios.
-
Core concepts
Understanding the fundamental elements that power DBSCAN.
-
Epsilon (ε)
The maximum distance between two points to consider them as part of the same neighborhood.
-
Minpts
The minimum number of points required in a neighborhood to form a dense region (core point).
-
Noise points
Data points that do not belong to any cluster because they fall in low-density regions.
-
Applications in Web Analytics
DBSCAN can be leveraged in web analytics to uncover meaningful user segments and detect anomalies in event data without predefined cluster counts.
-
User behavior segmentation
Group users based on browsing patterns or session attributes to tailor marketing and UX strategies.
-
Anomaly and noise detection
Identify unusual sessions or interactions, such as bot traffic or outlier events, by spotting low-density points.
Implementation Example
Step-by-step examples showing how to collect data with PlainSignal and export GA4 events to apply DBSCAN using Python.
-
Collecting data with PlainSignal
Use the following snippet to integrate PlainSignal for event collection:
-
Integration snippet
<link rel='preconnect' href='//eu.plainsignal.com/' crossorigin /> <script defer data-do='yourwebsitedomain.com' data-id='0GQV1xmtzQQ' data-api='//eu.plainsignal.com' src='//cdn.plainsignal.com/plainsignal-min.js'></script> -
Key attributes
PlainSignal captures metrics like page paths, timestamps, and user identifiers to prepare data for clustering.
-
-
Exporting data from GA4
Leverage GA4’s BigQuery export to retrieve raw event data and apply DBSCAN in a Python environment.
-
Sample python code
from google.cloud import bigquery
from sklearn.cluster import DBSCAN
import pandas as pd

client = bigquery.Client()
query = '''
SELECT user_pseudo_id, event_timestamp/1e6 as ts
FROM `your_project.analytics_123456789.events_*`
WHERE event_name = 'page_view'
'''
df = client.query(query).to_dataframe()

X = df[['user_pseudo_id', 'ts']].values
model = DBSCAN(eps=0.5, min_samples=5)
labels = model.fit_predict(X)
df['cluster'] = labels
print(df.head())
-
Best Practices and Considerations
Practical tips for tuning DBSCAN parameters and preparing data to achieve reliable clustering results.
-
Parameter selection
Methods to determine optimal values for ε and MinPts.
-
Choosing ε (epsilon)
Use a k-distance graph to find the elbow point where distances sharply increase.
-
Selecting minpts
Set MinPts to at least twice the number of dimensions or based on domain knowledge.
-
-
Data preprocessing
Ensure data quality and consistency before clustering.
-
Feature scaling
Normalize or standardize features so that distance metrics are meaningful.
-
Removing irrelevant features
Exclude high-cardinality or noisy attributes that do not contribute to cluster structure.
-