Published on 2025-06-26T05:07:41Z
What is Observability in Analytics? Examples with PlainSignal and GA4.
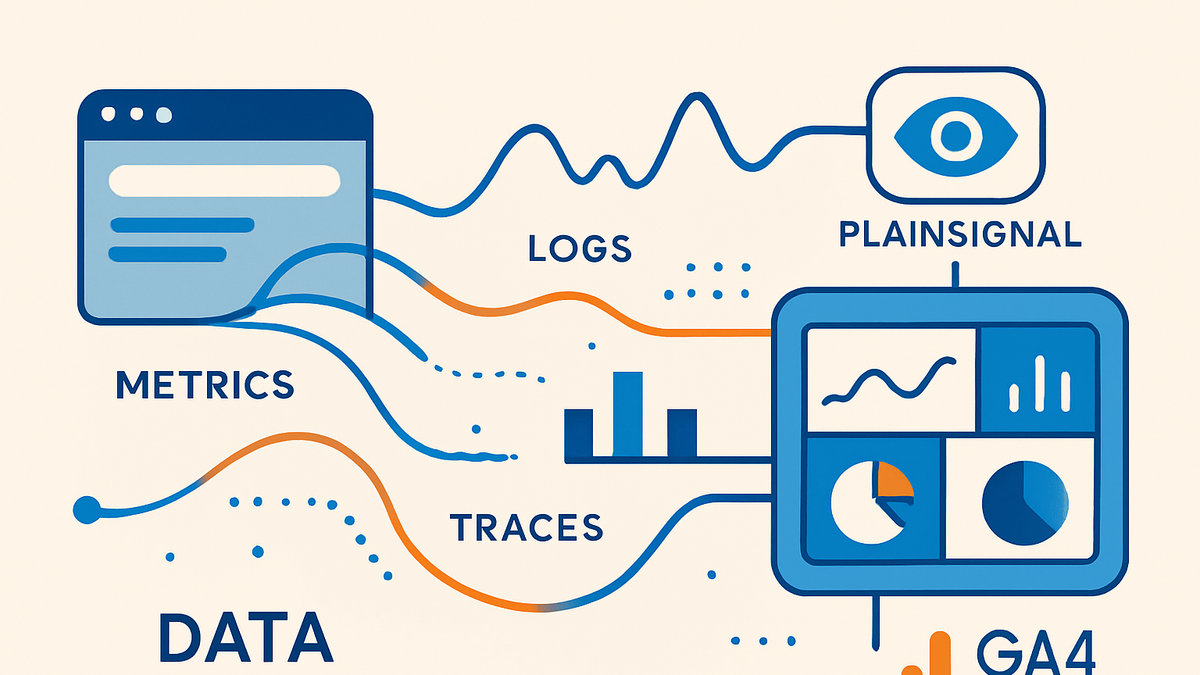
Observability in analytics is the practice of instrumenting systems to collect, correlate, and analyze data from multiple sources such as user events, system logs, and performance metrics. Unlike traditional monitoring, observability provides a holistic, real-time view of how different parts of an application interact and how users engage with your digital properties. In analytics, this enables teams to proactively detect anomalies, troubleshoot issues faster, and optimize user experiences. By leveraging SaaS tools like PlainSignal (a cookie-free, privacy-focused analytics platform) and GA4, which offers event-driven insights and advanced audience segmentation, organizations can build a robust observability pipeline. These platforms allow for straightforward event tracking, custom dashboard creation, and alert configuration to monitor key performance indicators continuously. Ultimately, observability empowers data-driven decisions by delivering actionable insights across the entire analytics stack.
Observability
Observability in analytics involves gathering and correlating metrics, logs, and traces via tools like PlainSignal and GA4 for actionable insights.
Why Observability Matters in Analytics
Observability transforms raw data into actionable insights by enabling teams to see the full context of user behavior and system performance. It helps in early anomaly detection, reduces mean time to resolution, and supports continuous optimization of digital experiences.
-
Improved troubleshooting
By correlating metrics, logs, and traces, observability allows rapid identification of root causes and reduces downtime.
-
Proactive performance monitoring
Real-time data collection and alerting help teams detect performance degradations before they impact users.
-
Data-driven decision-making
Comprehensive visibility into user interactions and system metrics supports strategic planning and feature prioritization.
Core Pillars of Observability
Observability rests on three data types—metrics, logs, and traces—that together provide a complete picture of system health and user behavior.
-
Metrics
Numerical measurements such as page views, load times, and error rates.
-
Latency
Time taken for requests to complete, critical for performance monitoring.
-
Throughput
Number of events or requests processed per unit time.
-
Error rate
Frequency of failed requests or exceptions to track reliability.
-
-
Logs
Event records that capture detailed information about system and application actions.
-
Error logs
Logs generated when exceptions or failures occur, useful for debugging.
-
Access logs
Records of user requests and status codes for traffic analysis.
-
Debug logs
Verbose logs used during development to trace code execution paths.
-
-
Traces
Distributed records of individual user or transaction journeys across services.
-
Request tracing
Tracking a single request through multiple services to identify bottlenecks.
-
User session tracing
Chronological view of user actions during a session for behavioral insights.
-
Implementing Observability with PlainSignal and GA4
Practical steps to instrument your website using PlainSignal for privacy-focused metrics and GA4 for event-driven analytics, then unify the data.
-
PlainSignal setup
To set up PlainSignal for cookie-free analytics, insert the following snippet into your head section:
<link rel="preconnect" href="//eu.plainsignal.com/" crossorigin /> <script defer data-do="yourwebsitedomain.com" data-id="0GQV1xmtzQQ" data-api="//eu.plainsignal.com" src="//cdn.plainsignal.com/plainsignal-min.js"></script> -
GA4 setup
To enable GA4 event tracking, add the following code to your pages, replacing G-XXXXXXXXXX with your measurement ID:
<script async src="https://www.googletagmanager.com/gtag/js?id=G-XXXXXXXXXX"></script> <script> window.dataLayer = window.dataLayer || []; function gtag(){dataLayer.push(arguments);} gtag('js', new Date()); gtag('config', 'G-XXXXXXXXXX'); </script> -
Data unification
Combine PlainSignal metrics with GA4 events in a centralized dashboard or data warehouse to correlate user behavior across privacy-focused and event-based data sources.
Best Practices and Considerations
Maximize observability impact by following naming conventions, ensuring data privacy compliance, and setting up meaningful alerts.
-
Consistent naming conventions
Use descriptive, standardized event and metric names to simplify aggregation and analysis.
-
Privacy and consent
Implement clear consent management and leverage cookie-free tools like PlainSignal to comply with privacy regulations.
-
Alerting and anomaly detection
Define thresholds and use automated alerts to proactively respond to unusual patterns or system issues.