Published on 2025-06-28T04:34:03Z
What is Performance Optimization? Examples and Best Practices
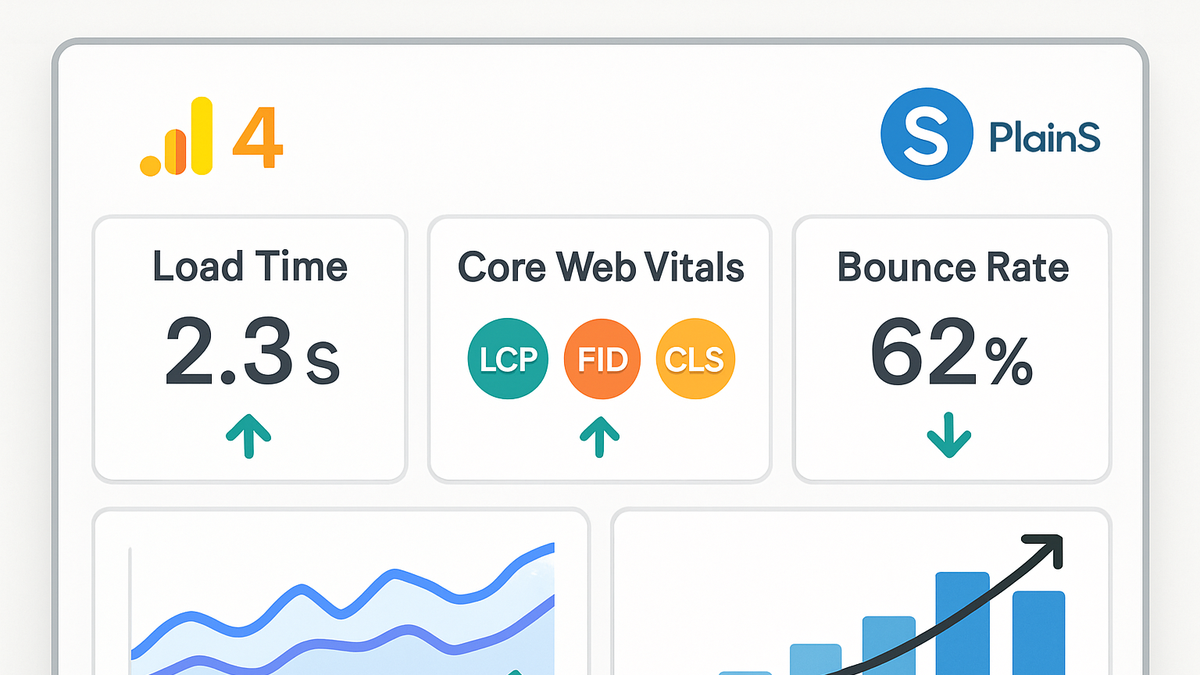
Performance Optimization in analytics refers to the continuous process of measuring, analyzing, and refining the speed and efficiency of digital properties such as websites and applications. It focuses on reducing page load times, improving responsiveness, and optimizing resource usage to deliver a smoother user experience. By leveraging analytics platforms like Google Analytics 4 (GA4) and privacy-friendly, cookie-free solutions such as PlainSignal, teams can collect real user monitoring (RUM) data, identify bottlenecks, and track key metrics without infringing on user privacy. Effective performance optimization can lead to higher engagement, better search engine rankings, and increased conversion rates. The process typically involves setting performance budgets, instrumenting key metrics, running tests, implementing improvements, and continuously monitoring for regressions.
Common metrics include page load time, Core Web Vitals, Time to First Byte (TTFB), and bounce rate, all of which guide data-driven optimization strategies.
Performance optimization
Using analytics to measure and improve website/app speed, responsiveness, and user experience through metrics, tools, and best practices.
Understanding Performance Optimization
Performance optimization is the systematic practice of measuring, analyzing, and improving the speed and efficiency of a digital property. In analytics, it ensures that web pages and applications respond quickly and utilize resources effectively to provide a seamless user experience. Optimization often involves code refinement, resource compression, and configuration tweaks aimed at reducing latency and processing time. By establishing clear performance goals, teams can prioritize development tasks and align improvements with business objectives.
-
Definition
A data-driven approach to enhance the responsiveness and load speed of websites and applications through analysis of key metrics.
-
Objectives
Primary goals include minimizing load times, boosting user engagement, and lowering bounce rates.
-
Speed
Decrease the time taken for pages and resources to load.
-
Responsiveness
Ensure user interactions like clicks and form submissions are processed instantly.
-
Efficiency
Optimize CPU, memory, and network usage to reduce resource consumption.
-
Key Metrics for Performance Optimization
Selecting the right metrics is critical for identifying performance bottlenecks and measuring the impact of optimizations. Analytics teams track several core indicators to gauge user experience and system health.
-
Page load time
Total time taken for the page to fully render in the user’s browser.
-
Core web vitals
A set of metrics (LCP, FID, CLS) defined by Google to quantify user-centric performance.
-
Time to first byte (ttfb)
Duration from request initiation until the first byte of the response is received.
-
Bounce rate
Percentage of sessions where users leave after viewing only a single page.
Analytics Tools and Integration
Modern analytics platforms offer specialized features for monitoring and optimizing performance metrics. Integration is typically achieved by embedding a small snippet of code on each page or view.
-
Google analytics 4 (GA4)
Google’s latest analytics platform provides web and app performance reports, custom metrics, and event-based modeling to track page timings and user interactions.
-
PlainSignal (cookie-free analytics)
A privacy-focused analytics solution that captures essential performance data without cookies or user tracking. Example integration:
<link rel='preconnect' href='//eu.plainsignal.com/' crossorigin />
<script defer data-do='yourwebsitedomain.com' data-id='0GQV1xmtzQQ' data-api='//eu.plainsignal.com' src='//cdn.plainsignal.com/plainsignal-min.js'></script>
Best Practices and Strategies
Adopting established best practices ensures that performance improvements are sustainable and aligned with industry standards.
-
Set performance budgets
Define numerical thresholds (e.g., JS bundle size, load time) to prevent regressions during development.
-
Prioritize critical resources
Optimize above-the-fold assets and defer non-critical scripts to improve perceived performance.
-
Implement caching and compression
Use techniques like gzip, Brotli, and CDN caching to reduce resource size and delivery time.
-
Monitor continuously
Establish real-time dashboards and alerting systems to detect performance degradations.
-
Dashboards
Visualize key metrics over time to identify trends and anomalies.
-
Alerts
Configure notifications for metric thresholds to prompt immediate investigation.
-
Optimization Workflow Example
A step-by-step example of how an analytics team might implement performance optimization using GA4 and PlainSignal.
-
Implement tracking
Embed analytics snippets (GA4 & PlainSignal) to start collecting baseline performance data.
-
Collect baseline metrics
Gather initial data on load times, Core Web Vitals, and bounce rates over a representative period.
-
Identify bottlenecks
Analyze reports to uncover slow-loading resources, large payloads, or render-blocking scripts.
-
Test improvements
Apply changes such as minification, lazy loading, or resource optimization and compare results against the baseline.
-
Deploy & monitor
Roll out successful optimizations to production and continuously monitor for regressions with dashboards and alerts.