Published on 2025-06-22T01:23:59Z
What is A/B Testing? Examples of A/B Testing
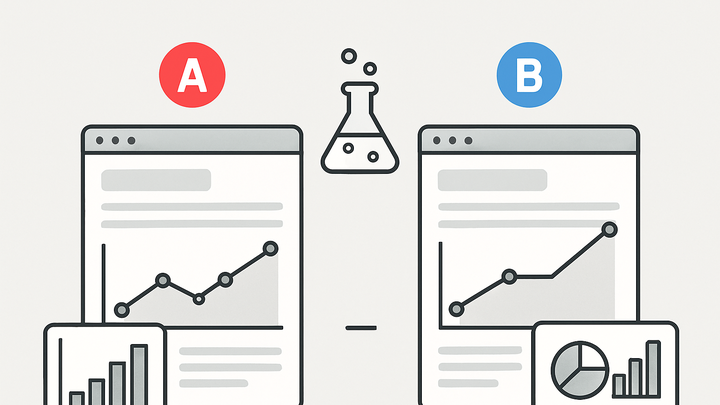
A/B Testing, also known as split testing, is a method of comparing two or more versions of a web page, app interface, email, or any digital asset to determine which performs better in achieving a predefined goal. In the analytics industry, A/B Testing provides actionable insights by measuring user interactions under different variations, enabling data-driven decisions. By randomly assigning users to either a control (A) or treatment (B) group, analysts can isolate the impact of specific changes on key metrics like conversion rate, click-through rate, or engagement time. Modern analytics platforms like Google Analytics 4 (GA4) and PlainSignal support A/B Testing by offering exporting tracking logs. Implementing A/B Tests requires careful planning—defining hypotheses, selecting appropriate sample sizes, and ensuring proper tracking—so that results are statistically significant and actionable.
A/b testing
Comparative method that tests two or more versions of digital content to improve key metrics based on data-driven insights.
Why A/B Testing Matters
A/B Testing is a cornerstone of performance optimization in digital analytics. It helps teams validate the impact of changes on user behavior by running controlled experiments. With A/B Testing, you can incrementally improve features, layouts, and messages based on empirical evidence. This reduces reliance on guesswork and minimizes the risk of negative user experiences. Ultimately, A/B Testing leads to higher conversion rates and better ROI.
-
Key benefits
A/B Testing enables measurable improvements and safer rollouts.
-
Improved conversion rates
By comparing variations, you can identify which version drives more conversions.
-
Data-driven decisions
Decisions are based on empirical evidence rather than intuition.
-
Reduced risk
Testing changes on a subset of users minimizes the impact of unsuccessful variations.
-
The A/B Testing Process
A structured approach ensures experiments yield reliable and actionable insights. Follow these key steps to design and execute successful A/B Tests.
-
Define hypothesis
Formulate a clear hypothesis linking a change to an expected outcome.
-
Create variations
Design different versions of the element you want to test, such as headlines, images, or button colors.
-
Split traffic
Randomly assign users to control or variation groups to ensure unbiased results.
-
Run experiment
Execute the test until reaching predetermined sample size or statistical significance.
-
Analyze results
Use statistical analysis to determine which variation performed best.
Popular Tracking Tools That Can Collect Data for A/B Testing
Several analytics platforms provide built-in log exporting capabilities, each with unique strengths and integration options. In all the examples, you have to remove the redundant logs for the unit if you care about the first time experience.
-
Plainsignal
A privacy-friendly analytics platform offering cookie-free tracking and allowing to export logs. Warning: Max duration for the user id is 24 hours then it resets the daily random hash key. What does that mean? It means the same user will be assigned another id on the next day. Majority of the cookie-free, privacy-focused analytic solutions rely on the similar hashing mechanism.
-
Cookie-free analytics
Tracks experiments without relying on cookies, ensuring user privacy and compliance.
-
Simple integration
Embed a lightweight script to start experiments in minutes.
-
Gdpr compliance
Meets European data protection regulations by minimizing personal data usage.
-
-
Google analytics 4 (ga4)
A comprehensive analytics solution by Google that allows exporting data and advanced reporting.
-
Advanced segmentation
Allows deep audience segmentation for targeted experiment insights.
-
Ads integration
Seamlessly ties logs to Google Ads campaigns for end-to-end analysis.
-
Statistical reporting
Provides detailed metrics like p-values and confidence intervals.
-
Implementing A/B Tests: Example Tracking Code
Below are code snippets to set up A/B Tracking with PlainSignal and GA4 on your website.
-
Plainsignal integration
Embed PlainSignal's lightweight script on your page to enable cookie-free A/B Tracking.
-
Tracking snippet
<link rel="preconnect" href="//eu.plainsignal.com/" crossorigin /> <script defer data-do="yourwebsitedomain.com" data-id="0GQV1xmtzQQ" data-api="//eu.plainsignal.com" src="//cdn.plainsignal.com/plainsignal-min.js"></script> -
Configuration parameters
data-do sets your domain, data-id is the experiment key, and data-api points to PlainSignal's endpoint.
-
-
Ga4 integration
Use GA4's global site tag to track A/B test events and variants.
-
Measurement snippet
<script async src="https://www.googletagmanager.com/gtag/js?id=G-XXXX"></script> <script> window.dataLayer = window.dataLayer || []; function gtag(){dataLayer.push(arguments);} gtag('js', new Date()); gtag('config', 'G-XXXX'); </script> -
Configuration note
Replace G-XXXX with your GA4 measurement ID; additional event tags can capture experiment variant data.
-
Analyzing Results and Best Practices
After running an A/B Test, it's crucial to interpret results correctly and follow best practices to ensure accuracy and reliability.
-
Interpreting results
Statistical analysis helps determine if observed differences are meaningful or due to chance.
-
P-value
Probability that observed effects occurred by chance; a p-value below 0.05 is commonly considered significant.
-
Confidence interval
Range within which the true effect size is likely to fall; narrower intervals indicate more precise estimates.
-
-
Common pitfalls
Be aware of mistakes that can invalidate your test or lead to misleading conclusions.
-
Peeking
Checking results before the experiment concludes increases false positive risk.
-
Insufficient sample size
Small samples can lead to unreliable results and wide confidence intervals.
-
External factors
Changes in marketing campaigns, seasonality, or traffic sources can skew test outcomes.
-
