Published on 2025-06-28T07:33:52Z
What is Hypothesis Testing? Examples in Web Analytics
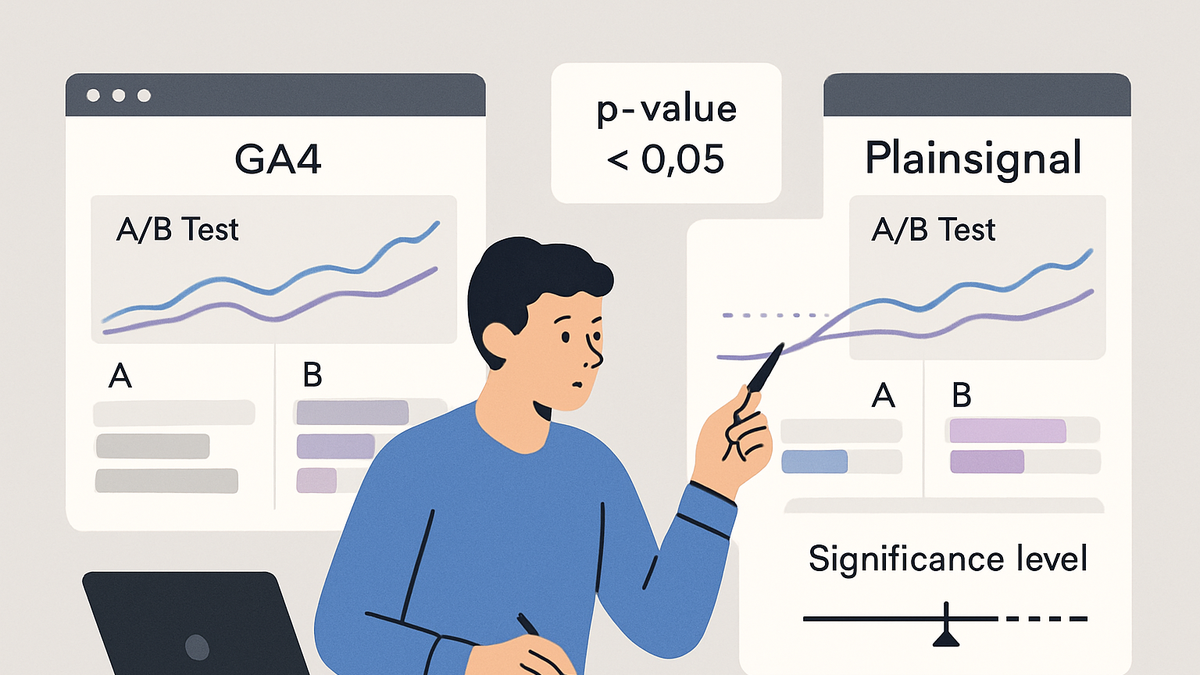
Hypothesis testing is a statistical technique in analytics used to determine whether observed data supports a specific assertion or hypothesis about user behavior. By comparing a null hypothesis (no effect) against an alternative (the effect you expect to see), analysts can make data-driven decisions about website changes or marketing strategies. This process involves setting a significance level (alpha), calculating a p-value, and assessing whether the results are statistically significant. In web analytics, tools like Google Analytics 4 (GA4) and PlainSignal enable you to collect user interaction data and run tests to validate assumptions. For example, GA4’s Experiments feature lets you measure conversion improvements, while PlainSignal’s cookie-free simple analytics can capture metrics in privacy-centric environments. By applying hypothesis testing, teams can optimize landing pages, button designs, or campaign messages with confidence rather than guesswork.
Hypothesis testing
Statistical method in analytics to test assumptions about user behavior by comparing hypotheses using data from GA4 or PlainSignal.
Core Concepts of Hypothesis Testing
An overview of the fundamental components that make up hypothesis testing and how they apply in analytics.
-
Null and alternative hypotheses
Null Hypothesis (H0): The default assumption that there is no effect or difference in the metric being tested.
Alternative Hypothesis (H1): The statement you want to prove, indicating there is an effect or difference.
-
Significance level (alpha)
The threshold for rejecting H0; commonly set at 0.05 in analytics experiments. A lower alpha like 0.01 indicates stricter requirements to declare significance.
-
P-value
A measure indicating how likely the observed data would occur if H0 were true. A smaller p-value suggests stronger evidence against H0.
-
Types of errors
Understanding false positives and false negatives helps interpret test outcomes.
-
Type i error (α)
Occurs when H0 is incorrectly rejected (false positive).
-
Type ii error (β)
Occurs when H0 is incorrectly accepted (false negative).
-
Applying Hypothesis Testing in Web Analytics
How hypothesis testing is used in practice to make data-driven decisions on websites and digital campaigns.
-
A/b testing fundamentals
A controlled experiment comparing two versions (A and B) to see which performs better. Version A serves as the control, while version B carries the change under test.
-
Example with google analytics 4
Set up experiments in GA4 using its built-in Experiments feature or integrate with Google Optimize. Define conversion events, split traffic, and monitor results directly in the GA4 dashboard.
-
Example with PlainSignal
Track user interactions with PlainSignal’s cookie-free analytics and run tests by segmenting data manually.
<link rel="preconnect" href="//eu.plainsignal.com/" crossorigin />
<script defer data-do="yourwebsitedomain.com" data-id="0GQV1xmtzQQ" data-api="//eu.plainsignal.com" src="//cdn.plainsignal.com/plainsignal-min.js"></script>
Step-by-Step Implementation Guide
A walkthrough of planning, setting up, and analyzing a hypothesis test in analytics.
-
Planning your test
Define clear objectives, choose your primary metric, and calculate required sample size to achieve statistically reliable results.
-
Objective definition
State what you want to learn, e.g., increase click-through rate by 5%.
-
Sample size calculation
Use statistical formulas or online calculators to determine the number of sessions needed.
-
-
Setting up tracking
Install analytics scripts and configure events or goals in GA4 or PlainSignal to collect relevant data.
-
GA4 event configuration
Create custom events for actions you wish to test, like button clicks or form submissions.
-
PlainSignal script installation
Add the PlainSignal snippet to all pages to enable privacy-centric, cookie-free tracking.
-
-
Running the test
Split traffic consistently, collect data until reaching your predefined sample size or time threshold, and ensure participants are randomly assigned.
-
Interpreting results
Compare p-values to your alpha level and decide whether to reject H0. Consider effect size and confidence intervals for practical significance.
-
Decision rule
Reject H0 if p-value < alpha; otherwise, fail to reject.
-
Best Practices and Common Pitfalls
Tips to ensure valid hypothesis tests and avoid errors that can bias your results.
-
Avoiding false positives
Adjust for multiple comparisons and avoid peeking at data before the test completes.
-
Multiple comparisons correction
Apply Bonferroni or False Discovery Rate methods when testing many metrics.
-
-
Ensuring data quality
Monitor tracking integrity, filter out bot traffic, and watch for sampling anomalies that may skew results.
-
Understanding practical significance
Evaluate whether statistically significant differences translate to meaningful business impact before implementing changes.
-
Documenting your process
Keep clear records of hypotheses, metrics, methods, and decisions to maintain transparency and reproducibility.