Published on 2025-06-28T05:19:06Z
What is a Confidence Interval? Definition, Examples, and SaaS Applications
A confidence interval (CI) is a range of values that estimates the true parameter of a population metric based on sample data. In analytics, it helps quantify the uncertainty around measurements like conversion rates, click-through rates, and average session duration. By providing upper and lower bounds, CIs prevent overconfidence in a single point estimate and support more informed decision-making. Commonly set at the 95% level, they are widely used in A/B testing, forecasting, and performance reporting. Platforms such as GA4 offer built-in statistical insights, while tools like PlainSignal let you export raw data for manual CI calculations.
Confidence interval
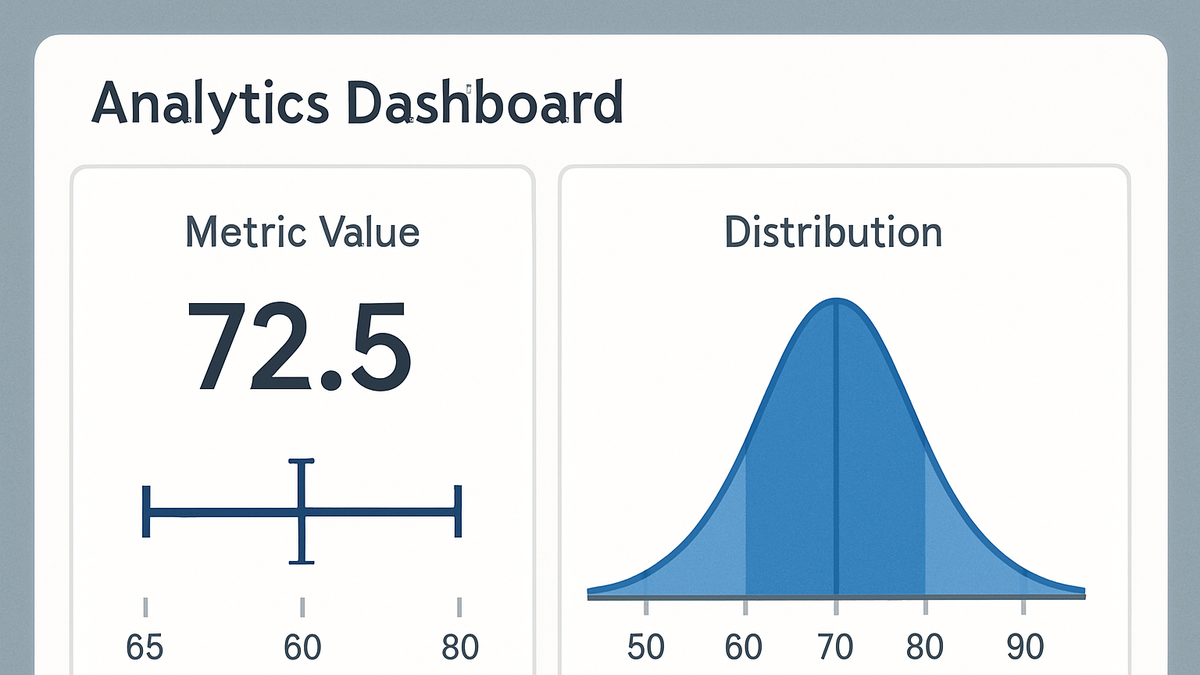
A confidence interval quantifies the uncertainty around analytics metrics by providing a range where the true value likely lies.
Why Confidence Intervals Matter in Analytics
Confidence intervals (CIs) provide context to raw metrics, highlighting the uncertainty inherent in sampling and measurement. They help teams distinguish between real performance changes and random fluctuations, reducing false positives in A/B testing and guiding data-driven decisions. Without CIs, analysts risk making overconfident conclusions based on point estimates alone.
-
Interpreting ranges
The upper and lower bounds of a CI reflect where the true metric value lies with a specified probability (e.g., 95%). A narrower interval indicates more precise estimates.
-
Decision making
By comparing CIs across segments or time periods, analysts can determine if observed differences are statistically meaningful before rolling out changes.
How to Calculate Confidence Intervals
Calculating CIs involves selecting the appropriate formula (mean vs. proportion), determining the standard error, and applying a z- or t-score multiplier. For large samples, z-scores are common, while smaller samples may require t-scores.
-
Standard formula
Use the general formula: CI = point estimate ± (critical value × standard error).
-
Mean ci
When measuring averages (e.g., session duration), standard error = sample standard deviation ÷ √sample size.
-
Proportion ci
For metrics like conversion rate, standard error = √[p×(1–p)÷n], where p is the sample proportion.
-
-
Example calculation
Compute a 95% CI for a conversion rate of 200 conversions out of 2,000 visits (p = 0.1).
-
95% ci for a proportion
Standard error = √[0.1×0.9÷2000] ≈ 0.0067. 95% z-score ≈ 1.96. Margin of error = 1.96 × 0.0067 ≈ 0.0131. CI = 0.1 ± 0.0131 → [0.0869, 0.1131].
-
Applying Confidence Intervals with SaaS Analytics Tools
Different analytics platforms offer built-in statistical features or support manual CI computations through data exports.
-
PlainSignal
PlainSignal provides cookie-free tracking and raw data exports, enabling you to calculate CIs externally.
-
Tracking setup
Add this snippet to your site’s
<head>to start collecting data:<link rel="preconnect" href="//eu.plainsignal.com/" crossorigin /> <script defer data-do="yourwebsitedomain.com" data-id="0GQV1xmtzQQ" data-api="//eu.plainsignal.com" src="//cdn.plainsignal.com/plainsignal-min.js"></script> -
Manual ci calculation
Export event counts (e.g., pageviews, conversions) as CSV and use a spreadsheet or script to apply CI formulas.
-
-
Google analytics 4 (GA4)
GA4 includes Experiment reports and Explorations for statistical analysis, showing CIs on experiment results and custom metrics.
-
Experiments feature
Set up an A/B test in GA4 to view confidence intervals around experiment variant performance directly in the UI.
-
Explorations analysis
Use the Exploration tool to define custom metrics and apply statistical functions to calculate CIs for any dimension.
-