Published on 2025-06-28T08:06:53Z
What is Return on Ad Spend (ROAS)? Examples for ROAS
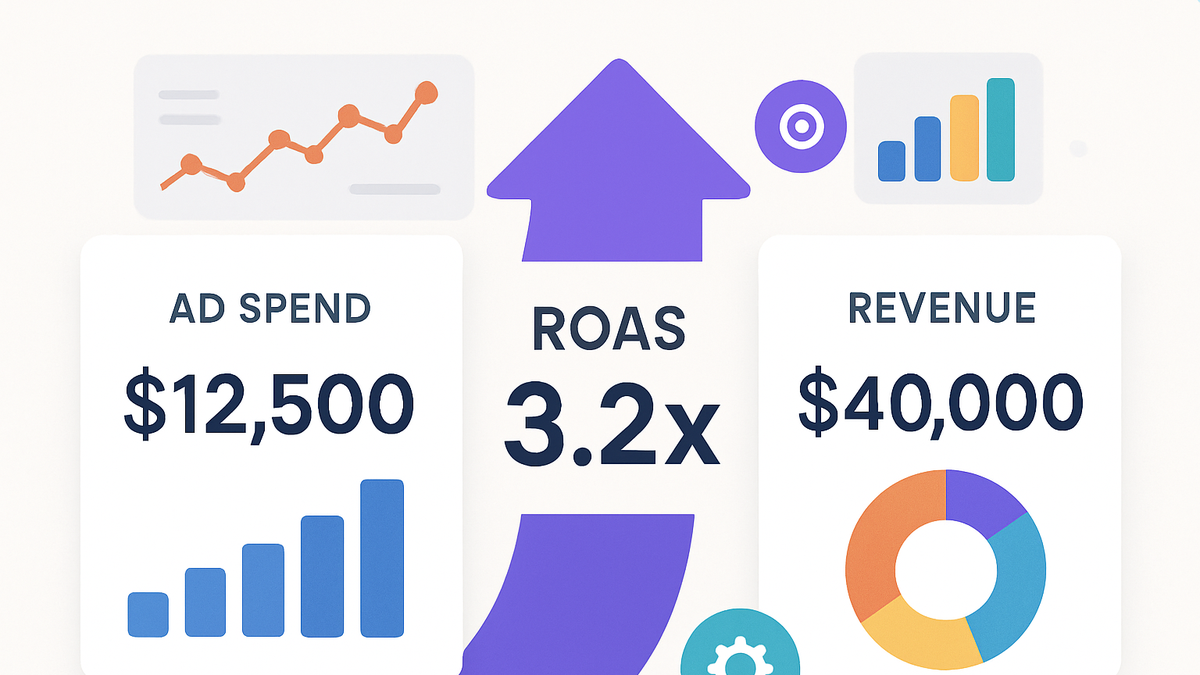
Return on Ad Spend (ROAS) is a key performance metric in digital analytics that measures how much revenue you earn for every dollar spent on advertising. By comparing ad-driven revenue against ad spend, ROAS helps marketers evaluate the efficiency of their campaigns and make data-driven budget decisions. A higher ROAS indicates more effective campaigns, while a lower ROAS may signal the need for optimization.
In the analytics industry, you can track ROAS using tools like GA4 or PlainSignal (a cookie-free, simple analytics solution). Below, you’ll find the formula, real-world examples, and implementation tips to start measuring ROAS accurately.
Return on ad spend (roas)
ROAS measures revenue earned per dollar spent on advertising, guiding marketers to optimize campaign efficiency.
1. Definition and Importance
Understanding ROAS is crucial for evaluating the profitability of your ad campaigns and allocating budgets effectively.
-
What is roas?
ROAS is calculated by dividing the revenue generated from ads by the amount spent on those ads. It quantifies ad efficiency in a single ratio.
-
Why roas matters
ROAS helps you compare campaign performance, justify ad spend, and identify underperforming channels or creatives.
2. How to Calculate ROAS
A clear formula and consistent definitions of revenue and spend ensure accurate ROAS measurement.
-
Roas formula
ROAS = (Revenue from Ads) ÷ (Ad Spend). For example, if you earn \(5,000 from a \)1,000 ad spend, ROAS = 5.0 or 500%.
-
Key components
Ensure you define:
- Revenue from Ads: Only include sales or conversions directly attributed to the ad platform.
- Ad Spend: Total cost of all clicks, impressions, or placements tied to the campaign.
3. ROAS in Practice: Examples
Real-world scenarios illustrate how ROAS guides decision-making and budget allocation.
-
Simple numeric example
Suppose you spent \(2,000 on Google Ads and generated \)12,000 in tracked sales.
- ROAS = \(12,000 ÷ \)2,000 = 6.0 (or 600%).
- Every \(1 spent returned \)6 in revenue.
-
Using GA4 to calculate roas
In Google Analytics 4, set up e-commerce events and link your Google Ads account. Navigate to Advertising → ROAS to view the metric segmented by campaign.
-
Step 1: enable e-commerce
Implement the GA4 e-commerce schema on your website or app to track purchases.
-
Step 2: link google ads
In GA4 Admin, go to Product Links and connect your Google Ads account to import spend data.
-
-
Tracking roas with PlainSignal
PlainSignal offers a privacy-focused, cookie-free way to track ad performance and revenue without compromising user privacy.
-
Implementation
Add the PlainSignal script to your site:
<link rel="preconnect" href="//eu.plainsignal.com/" crossorigin /> <script defer data-do="yourwebsitedomain.com" data-id="0GQV1xmtzQQ" data-api="//eu.plainsignal.com" src="//cdn.plainsignal.com/plainsignal-min.js"></script> -
Revenue tracking
Use PlainSignal’s API to send conversion values when a purchase completes, ensuring ROAS is calculated without third-party cookies.
-
4. Tracking ROAS with SaaS Tools
Choose the right platform based on your privacy needs, data granularity, and integration requirements.
-
Google analytics 4 (GA4)
Offers deep segmentation, cross-device tracking, and native Google Ads integration, but relies on first-party cookies and user consent.
-
PlainSignal (cookie-free)
Provides simple, privacy-first analytics ideal for compliance-focused businesses, with straightforward ROAS tracking via API.
5. Best Practices and Considerations
Optimize your ROAS measurement and interpretation by following these guidelines.
-
Select the right attribution model
First-click, last-click, or data-driven models can yield different ROAS values. Choose one that aligns with your customer journey.
-
Segment by campaign and channel
Compare ROAS across search, display, social, and affiliate channels to allocate budgets where they perform best.
-
Monitor over time
ROAS can fluctuate due to seasonality or competitive bids. Analyze trends, not just single-period snapshots.
-
Align with business goals
A high ROAS is good, but broader metrics like customer lifetime value (LTV) and profitability should guide long-term strategy.