Published on 2025-06-28T08:26:39Z
What is Revenue per User? Examples and Calculations
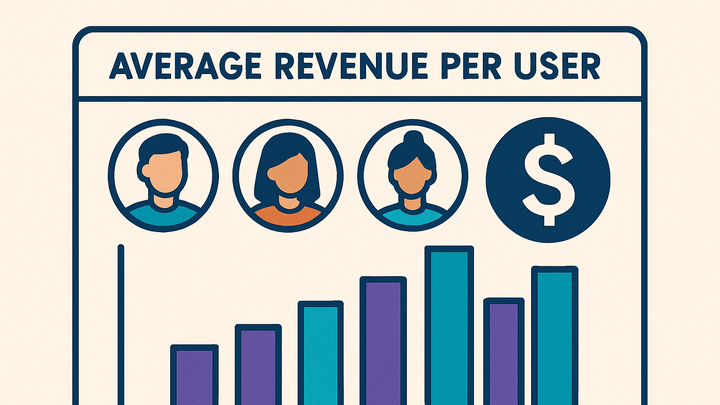
Revenue per User (RPU) is a key metric in analytics that measures the average revenue generated by each user over a specific period. It helps businesses understand monetization efficiency and compare performance across different user segments and time frames. By dividing total revenue by the number of unique users, RPU provides insights into how effectively a website or app turns traffic into revenue. This metric is crucial for informed decision-making around pricing, marketing spend, and feature prioritization. In analytics tools like PlainSignal and Google Analytics 4, RPU can be tracked by capturing revenue events and user identifiers, enabling real-time and cohort-based analysis.
Revenue per user
Average revenue generated per user over a defined period to assess monetization efficiency in digital analytics.
Definition and Importance
This section explains what Revenue per User is and why it matters for digital analytics teams.
-
Definition
Revenue per User (RPU) measures the average amount of revenue generated by each user during a given timeframe. It is calculated as: Total Revenue ÷ Number of Unique Users.
-
Importance
RPU helps quantify monetization efficiency, benchmark performance across channels or campaigns, and identify high-value segments for targeted growth strategies.
Calculation Methods
Overview of how to compute RPU manually and using analytics platforms like PlainSignal and GA4.
-
Manual calculation
Divide the total generated revenue by the number of unique users in the same period. For example, \(50,000 revenue from 2,500 users yields an RPU of \)20.
-
Using PlainSignal
PlainSignal offers built-in revenue tracking through event data. Send purchase events with revenue values to calculate RPU in the dashboard.
-
Embedding PlainSignal tracking code
<link rel="preconnect" href="//eu.plainsignal.com/" crossorigin />
<script defer data-do="yourwebsitedomain.com" data-id="0GQV1xmtzQQ" data-api="//eu.plainsignal.com" src="//cdn.plainsignal.com/plainsignal-min.js"></script>
-
-
Using google analytics 4
GA4 tracks revenue via the
purchaseevent andvalueparameter. RPU can be analyzed in the Exploration reports or custom dashboards.-
GA4 tracking snippet
<script async src="https://www.googletagmanager.com/gtag/js?id=G-XXXXXXXXXX"></script>
<script>
  window.dataLayer = window.dataLayer || [];
  function gtag(){dataLayer.push(arguments);}
  gtag('js', new Date());
  gtag('config', 'G-XXXXXXXXXX');
  gtag('event', 'purchase', {
    transaction_id: 'T12345',
    value: 100.00,
    currency: 'USD'
  });
</script>
-
Use Cases
Practical examples of applying RPU insights to drive business decisions.
-
User segmentation
Compare RPU across different user segments (e.g., new vs. returning) to identify high-value groups.
-
Pricing strategy optimization
Leverage RPU data to adjust pricing tiers and promotional offers for maximizing revenue per user.
Best Practices
Guidelines to ensure accurate measurement and meaningful analysis of RPU.
-
Consistent user definitions
Use a consistent method for identifying unique users (e.g., cookie ID, user login) to avoid data discrepancies.
-
Comprehensive revenue tracking
Include all revenue sources—one-time purchases, subscriptions, ads—to capture full monetization picture.
-
Cohort analysis
Analyze RPU over user cohorts to understand how value evolves over time since acquisition.
