Published on 2025-06-28T07:14:43Z
What is ROAS? Return on Advertising Spend in Analytics
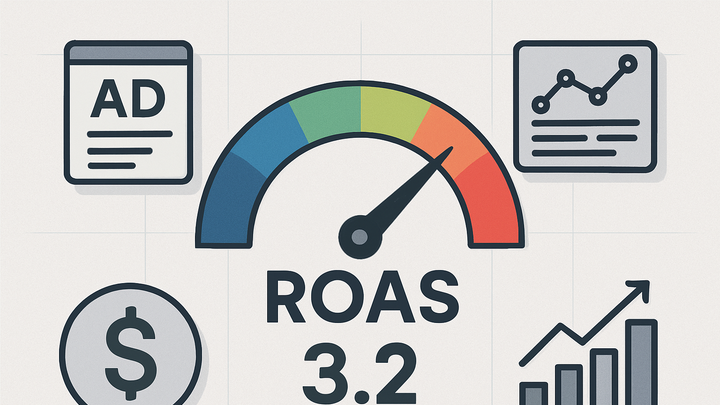
Return on Advertising Spend (ROAS) is a key marketing metric that measures the revenue generated for each dollar spent on advertising. In analytics, ROAS helps businesses evaluate the effectiveness of their ad campaigns, guiding budget allocation and optimization decisions. A higher ROAS indicates more efficient use of advertising budgets, while a lower ROAS signals campaigns that may need tweaking. ROAS is commonly represented as a ratio or percentage, calculated by dividing ad-driven revenue by advertising costs. Analytics platforms like Google Analytics 4 (GA4) and privacy-focused tools like PlainSignal enable marketers to track ROAS by capturing cost and revenue data across campaigns.
Roas
ROAS measures revenue earned per dollar of ad spend, helping optimize marketing budgets and campaign performance.
Understanding ROAS
ROAS stands for Return on Advertising Spend and quantifies how much revenue a campaign generates relative to its cost. It gives marketers a direct view of ad efficiency, allowing them to compare performance across channels and campaigns.
-
Definition of roas
ROAS = Revenue from ad campaign ÷ Cost of ads. For example, \(5,000 in sales from a \)1,000 ad spend yields a ROAS of 5 (or 500%).
-
Roas vs roi
While ROAS focuses solely on advertising spend, ROI (Return on Investment) considers all costs and profits, including production and operational expenses.
Calculating ROAS
Calculating ROAS helps determine which campaigns drive the most revenue per dollar spent. Tracking this metric consistently allows for data-driven budget shifts toward higher-performing ads.
-
Basic formula
ROAS = (Revenue ÷ Ad Cost). A ROAS of 4 means you earn \(4 for every \)1 spent.
-
Ratio vs percentage
ROAS can be presented as a ratio (e.g., 4:1) or a percentage (e.g., 400%). Choose the format that best fits your reporting style.
Why ROAS Matters
ROAS drives key decisions in marketing strategy, from budget allocation to creative testing. By comparing ROAS across campaigns and channels, marketers can maximize return and reduce waste.
-
Budget allocation
Allocate more budget to campaigns and channels delivering higher ROAS to maximize revenue efficiency.
-
Campaign optimization
Use ROAS trends to refine ad targeting, bidding strategies, and creative assets for continuous improvement.
Tracking ROAS in Analytics Platforms
Modern analytics tools like GA4 and PlainSignal capture both ad cost and revenue events, automating ROAS calculation within the platform.
-
Google analytics 4 (GA4)
GA4 combines imported ad cost data with purchase events to calculate ROAS in Advertising reports.
-
Integration steps
- Add the gtag.js snippet to all pages
- Enable Advertising Features in GA4 settings
- Link Google Ads and import cost data
- Ensure purchase events include value and currency parameters
-
Pros & cons
Pros: Free, seamless with Google Ads. Cons: Cookie-based data, complex multi-step setup.
-
-
PlainSignal (cookie-free simple analytics)
PlainSignal offers privacy-focused analytics with event tracking for revenue measurement without cookies.
-
Add tracking snippet
Include the PlainSignal script on your site:
<link rel="preconnect" href="//eu.plainsignal.com/" crossorigin /> <script defer data-do="yourwebsitedomain.com" data-id="0GQV1xmtzQQ" data-api="//eu.plainsignal.com" src="//cdn.plainsignal.com/plainsignal-min.js"></script> -
Track revenue events
After installing the script, send purchase events with revenue data:
<script>
  PlainSignal('track', 'purchase', {
    transaction_id: 'T12345',
    value: 150.00,
    currency: 'USD'
  });
</script>
-
