Published on 2025-06-28T04:07:57Z
What is an SLO? Examples of SLOs in Analytics
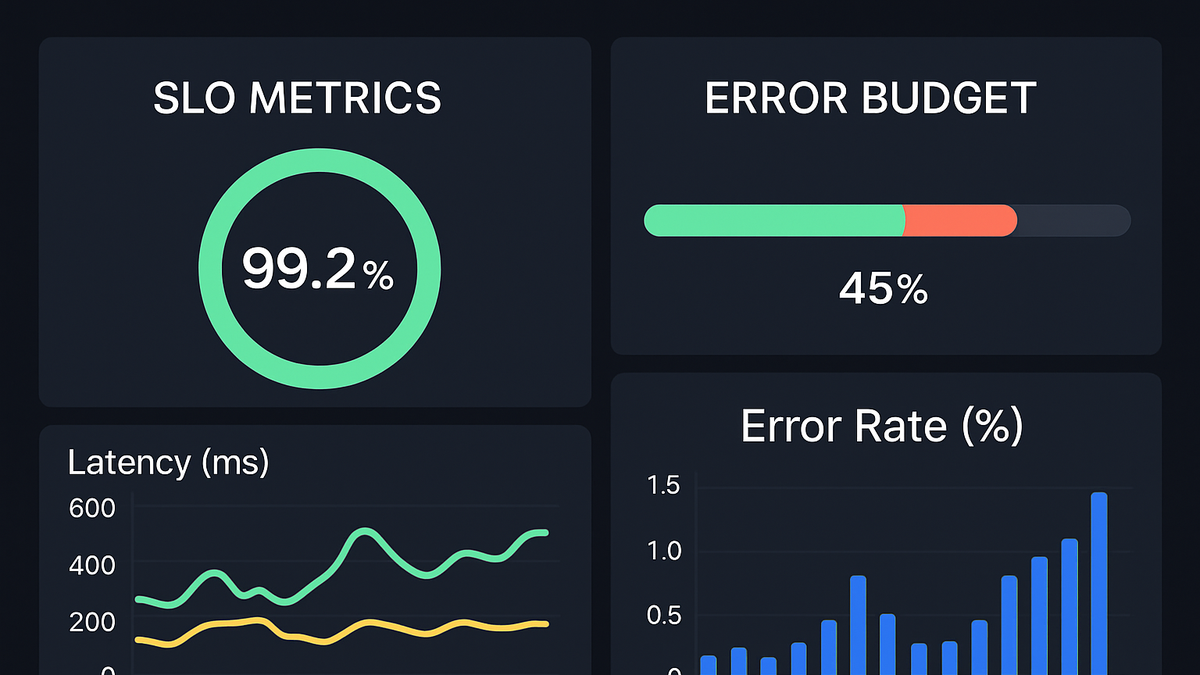
Service Level Objective (SLO) is a measurable target for the performance or availability of a service or feature in an analytics environment. It represents the level of service a team aims to deliver to its users or stakeholders. SLOs are defined using Service Level Indicators (SLIs) — the specific metrics you track — and can be tied to an error budget, which quantifies acceptable deviation. In analytics, SLOs ensure that key metrics like data freshness, event processing latency, and dashboard load times meet agreed-upon standards. By setting SLOs, teams can prioritize reliability improvements, monitor performance proactively, and maintain user trust. Tools like PlainSignal and Google Analytics 4 (GA4) can be configured to help define, track, and report on SLOs, providing real-world examples of how SLOs drive operational excellence.
Slo
An SLO is a measurable performance target for analytics services, ensuring reliability and guiding improvements based on SLIs and error budgets.
Definition of SLO
An SLO (Service Level Objective) specifies a target value or range for a service metric over a defined period. It sits between the raw measurement (SLI) and the contractual promise (SLA).
-
Core components
Understanding SLOs involves three key components:
-
Service level indicator (sli)
A specific metric that measures service performance or reliability, such as latency, error rate, or data freshness.
-
Error budget
The allowable margin of error for an SLO, calculated as 100% minus the SLO target (e.g., for a 99.9% availability SLO, the error budget is 0.1%).
-
Service level agreement (sla)
A formal contract or agreement that often uses SLOs to outline consequences if the service falls below agreed targets.
-
Why SLOs Matter in Analytics
SLOs help analytics teams align on performance goals, improve service reliability, and focus on what truly impacts user experience. They provide a data-driven approach to prioritize engineering efforts and communicate expectations with stakeholders.
-
Align performance goals
SLOs create shared targets across teams, ensuring that everyone works towards measurable outcomes like dashboard load times under 2 seconds.
-
Improve reliability
By monitoring SLO compliance, teams can detect and address issues before they escalate into major outages or data delays.
-
Prioritize improvements
Error budgets highlight where reliability is slipping, guiding teams to focus on high-impact fixes rather than low-value features.
-
Stakeholder communication
Clear SLOs enable transparent reporting to business stakeholders, building trust through consistent delivery against defined targets.
Setting and Monitoring SLOs
Effective SLO management involves selecting meaningful SLIs, defining realistic targets, instrumenting monitoring, and regularly reviewing performance.
-
Defining meaningful slis
Choose metrics that reflect user experience, such as API response time or data sync latency.
-
Response time
Measure the time it takes for a page or API to respond to user requests.
-
Error rate
Track the percentage of failed requests or data processing errors.
-
Data freshness
Monitor how up-to-date the analytics data is, e.g., maximum delay between event generation and reporting.
-
-
Setting realistic targets
Base SLO targets on historical performance data, user expectations, and business impact.
-
Implementing monitoring
Use analytics platforms to collect SLI data and visualize SLO compliance with alerts for breaches.
-
Reviewing and adjusting
Regularly evaluate SLO performance during retrospectives, adjust targets, and refine monitoring configurations.
Examples with PlainSignal and GA4
Here’s how you can implement and monitor SLOs using PlainSignal and Google Analytics 4.
-
PlainSignal (cookie-free analytics)
Track a page load time SLO of 2 seconds for 99% of sessions:
-
Implementation
Add the PlainSignal script to your site:
<link rel="preconnect" href="//eu.plainsignal.com/" crossorigin /> <script defer data-do="yourwebsitedomain.com" data-id="0GQV1xmtzQQ" data-api="//eu.plainsignal.com" src="//cdn.plainsignal.com/plainsignal-min.js"></script> -
Monitoring
In PlainSignal’s dashboard, create an SLO chart for ‘Page Load Time’ and set a threshold at 2 seconds. Configure alerts if the 99th percentile exceeds the target.
-
-
Google analytics 4 (GA4)
Define an SLO for data freshness, ensuring events are processed within 5 minutes for 99% of events:
-
Configuration
In GA4, enable real-time reporting and custom metrics to capture event ingestion timestamps.
-
Dashboards
Use GA4’s Explorations or Data Studio to build an SLO dashboard showing ‘Time to First Event’ distribution and SLO compliance.
-